

The Langston (Double Lumen Pigtail Catheter) is Back: With Some Thoughts on the Hemodynamics of Aortic Stenosis
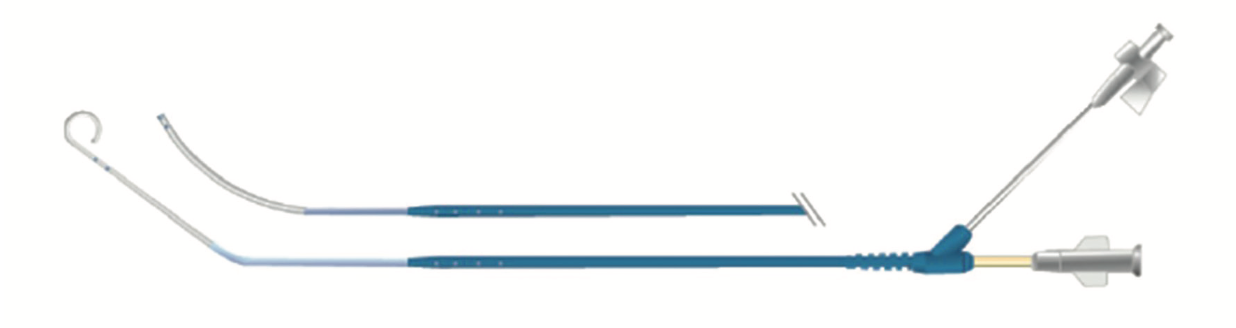
Invasive transvalvular hemodynamics have been relegated to the ‘next test’ after the echocardiogram for important treatment decisions in patients with aortic stenosis (AS), typically utilized only when there is a conflict between the clinical story, physical examination, and echo data. For many years, the cath lab had the convenient ability to measure the pressure gradient with a single catheter (Langston [Teleflex], Figure 1) with two lumens to record simultaneous left ventricular (LV) and aortic pressures at rest or with dobutamine infusion. Through direct invasive measurement, the cath lab could ascertain the true severity of AS, including cases of low-flow, low-gradient AS.
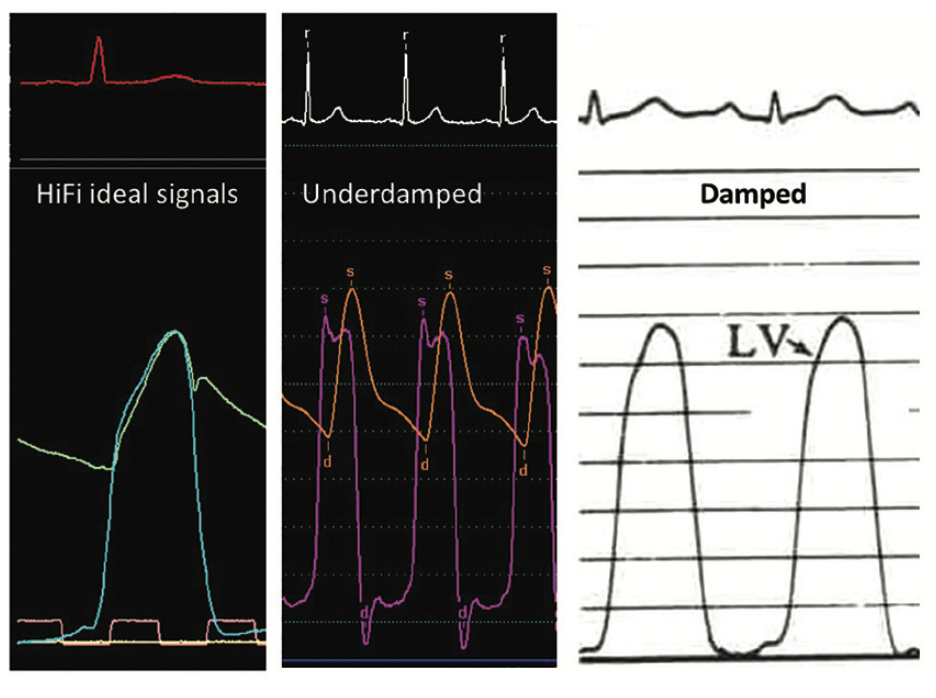
Hemodynamic devotees lamented the withdrawal of the Langston catheter in May of 2021 due to a voluntary recall by Teleflex, the manufacturer. What were we going to do without this accurate, easy, and relatively inexpensive method of AS evaluation? We answered this question in a previous CLD Clinical Editor’s page1 with suggestions on how to work around this loss. On the list of alternatives (Table 1), I was a particular fan of the .014-inch pressure wire through a diagnostic or guide catheter to measure aortic (Ao)/LV pressures. Other operators favored some variation of mother-in-child (6 French [F], with 4F catheter within) techniques, but all options were on the table.
Over the past year, while we were working around the missing Langston, Teleflex was working, too. After 18 months, the company cleared the FDA process and re-released the product to the market (see Chris Buller’s September 2022 letter2 about the return of the Langston dual lumen catheter). I added my thoughts2 to his letter and reminded us that the best and most often used methods in medicine are those that are efficient, accurate, and cost effective. The Langston catheter fits the bill in this regard.
Langston’s Road to Return
The story of the Langston catheter’s recall and reintroduction is a real demonstration of our industry partner’s concern for patient safety and good management. What happened to the catheter and how was it fixed? In 2020 to early 2021, 10 device failures (rupture and separation) were reported from nearly 20,000 units sold. The company did a voluntary recall and set about finding the root cause. Several human, environmental, and technical factors were investigated, such as torque and bending applied to the hub, thermal degradation, ultraviolet light exposure, and so on. It was discovered that excess cyanoacrylate adhesive on the inner shaft created a brittle/stiffer section of the device under the strain relief, a flexible extension covering the hub and shaft insertion. The lack of flexibility after manipulation led to micro fissures. Teleflex instituted design changes that eliminated excess adhesive and the cause of catheter failures during use. The reintroduction to the cath labs required making the design changes, an arduous process in the best of circumstances, and followed a timeline similar to that of releasing a new product into the marketplace.
Teleflex should be commended for a job well done in identifying the problem and implementing improvements leading to the FDA’s green light for reintroduction to the market in record time. Kudos to Teleflex for a rapid product turnaround to help our patients with AS.
Update on Best Practices for Aortic Stenosis Hemodynamics
On September 19, 2022, at the TCT conference, Teleflex sponsored a symposium on best practices for understanding and applying hemodynamics to measure aortic stenosis. I was fortunate to moderate and present a review along with Nils Johnson, University of Texas (Houston) and Geraldine Ong, St. Michael’s Hospital (Toronto). I thought it would be helpful to summarize what we learned.
Indications for Invasive Hemodynamics Assessment in Aortic Stenosis
In 2022, it is uncommon to cross an aortic valve for ventriculography, let alone to assess the severity of AS. Echocardiography has replaced the LV gram for ejection fraction estimates (but not LV end diastolic pressure [LVEDP]) and is the tool of choice for establishing AS severity. However, we should recall that there are guidelines for transvalvular hemodynamics. The 2020 ACC/AHA Guideline for the Management of Patients with Valvular Heart Disease: Indications for hemodynamic assessment of AS, by Otto C et al3, states catheter hemodynamics are appropriate when there is:
1. Inconclusive echo data, particularly in the symptomatic AS patient;
2. A discrepancy between the noninvasive tests and clinical findings;
3. A need for a dobutamine challenge in low-flow severe AS;
4. A question of symptoms related to exercise in an AS patients.
Of importance was the committee’s admonition that “a hemodynamic catheterization needs to be done with meticulous attention to detail by persons with knowledge and expertise in assessing patients with valvular heart disease…”, a statement with which I’m sure we can all agree.
Good Data Starts With Good Technique
This figure was published in the Journal of the Society for Cardiovascular Angiography & Interventions, Vol 1, Larry S. Dean, Morton J. Kern, Getting From A to C: From Pressure Waves to Graphic Display to Interpretation, 100034, Copyright Elsevier (2022).
Dr. Larry S. Dean, University of Washington (Seattle) was to start the symposium, but had an unforeseen last-minute problem and passed his talk on to me. He pointed out that good data always starts with a good setup, eliminating artifacts, and optimizing signal fidelity.
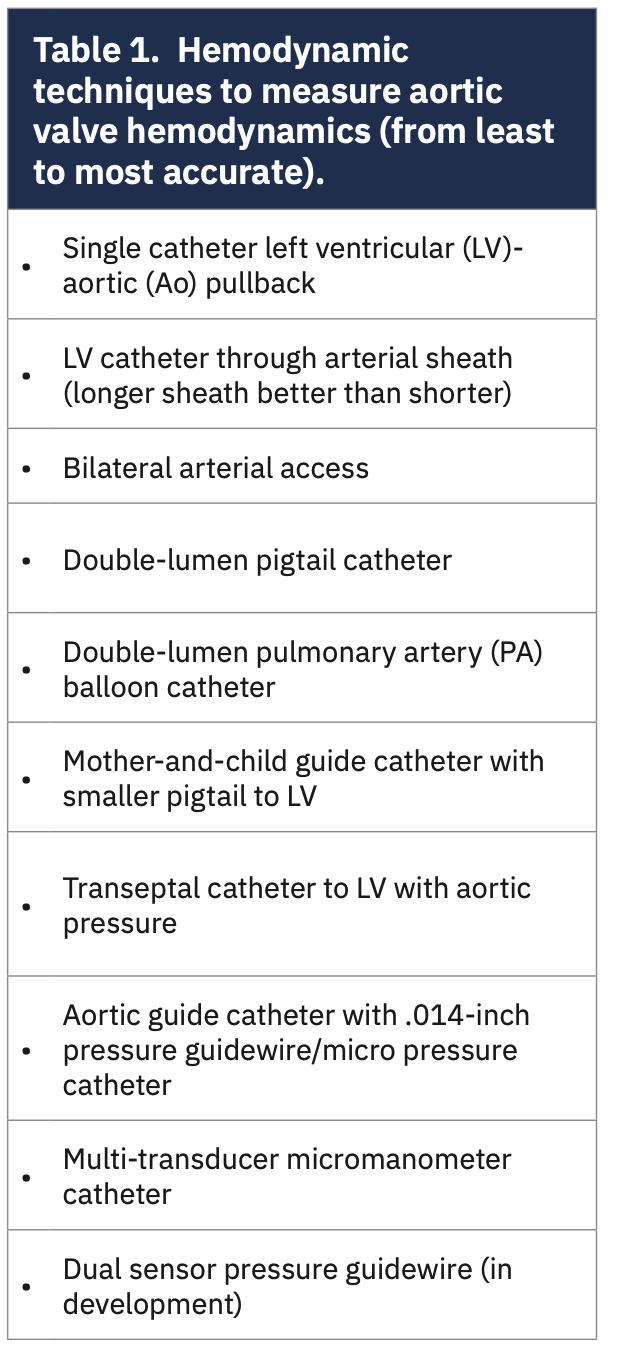
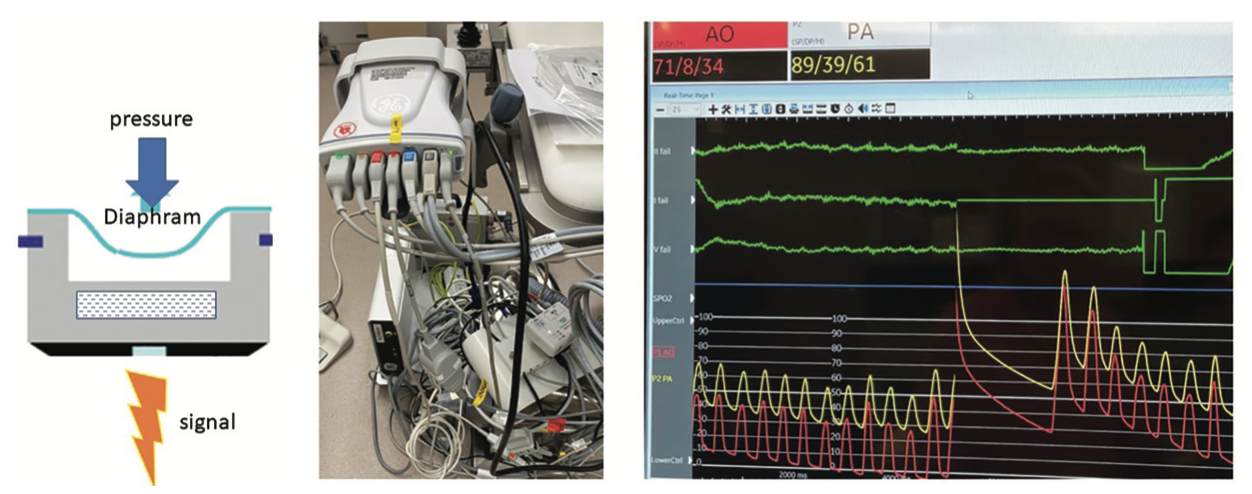
The fundaments of measuring pressures in the cath lab begin with the understanding that a cardiac pressure wave is converted to an electrical signal by a pressure transducer (Figure 2). Although the construction of different transducers varies, in general, a transducer in the cath lab works by having a pressure wave deform a diaphragm mounted on a small fixture containing a crystal or similar sensor that generates electricity when compressed. (The electrical signal is equal to the pressure deformation. There are also optical transducers with a different mechanism that generate the same result.) The accuracy and fidelity of the pressure signal depend on the frequency response of the entire system, which includes the transducer connections, pressure tubing, and catheters. Furthermore, there is a requirement that the frequency response be within the physiologic range of the cardiac pressures, meaning not too high or low to miss the true cardiac waveform. The system should be correctly damped and there should be no signal drift (Figure 3). An underdamped or overdamped signal will lead to “lost” data or misinterpretation. Recall that all fluid-filled systems (fluid-filled transducers as well) have more artifacts than solid state transducers. When beginning a case, don’t forget to pay attention to the initial setup, which includes zero position settings, transducer height, transducer calibrations, loose connections, air bubbles, and recorder scales and timing.
An ideal pressure recording system would have short, noncompliant tubing with a larger diameter lumen and fluid viscosity that would produce a suitable frequency response. [Note: Most fluid-filled systems use saline, which results in a relatively undamped system.] Consider reversing the tubing connections between the LV and Ao to confirm that the gradient is consistent. Lastly, when interpreting computer readouts of your hemodynamic monitory, double check the numbers, as they may not be correct for the waveforms analyzed and selected by the computer. It’s always a good idea to check the tracings yourself. Dr. Dean’s bottom line: “…review your patient’s hemodynamics. Do they make clinical sense? If not, why not?”
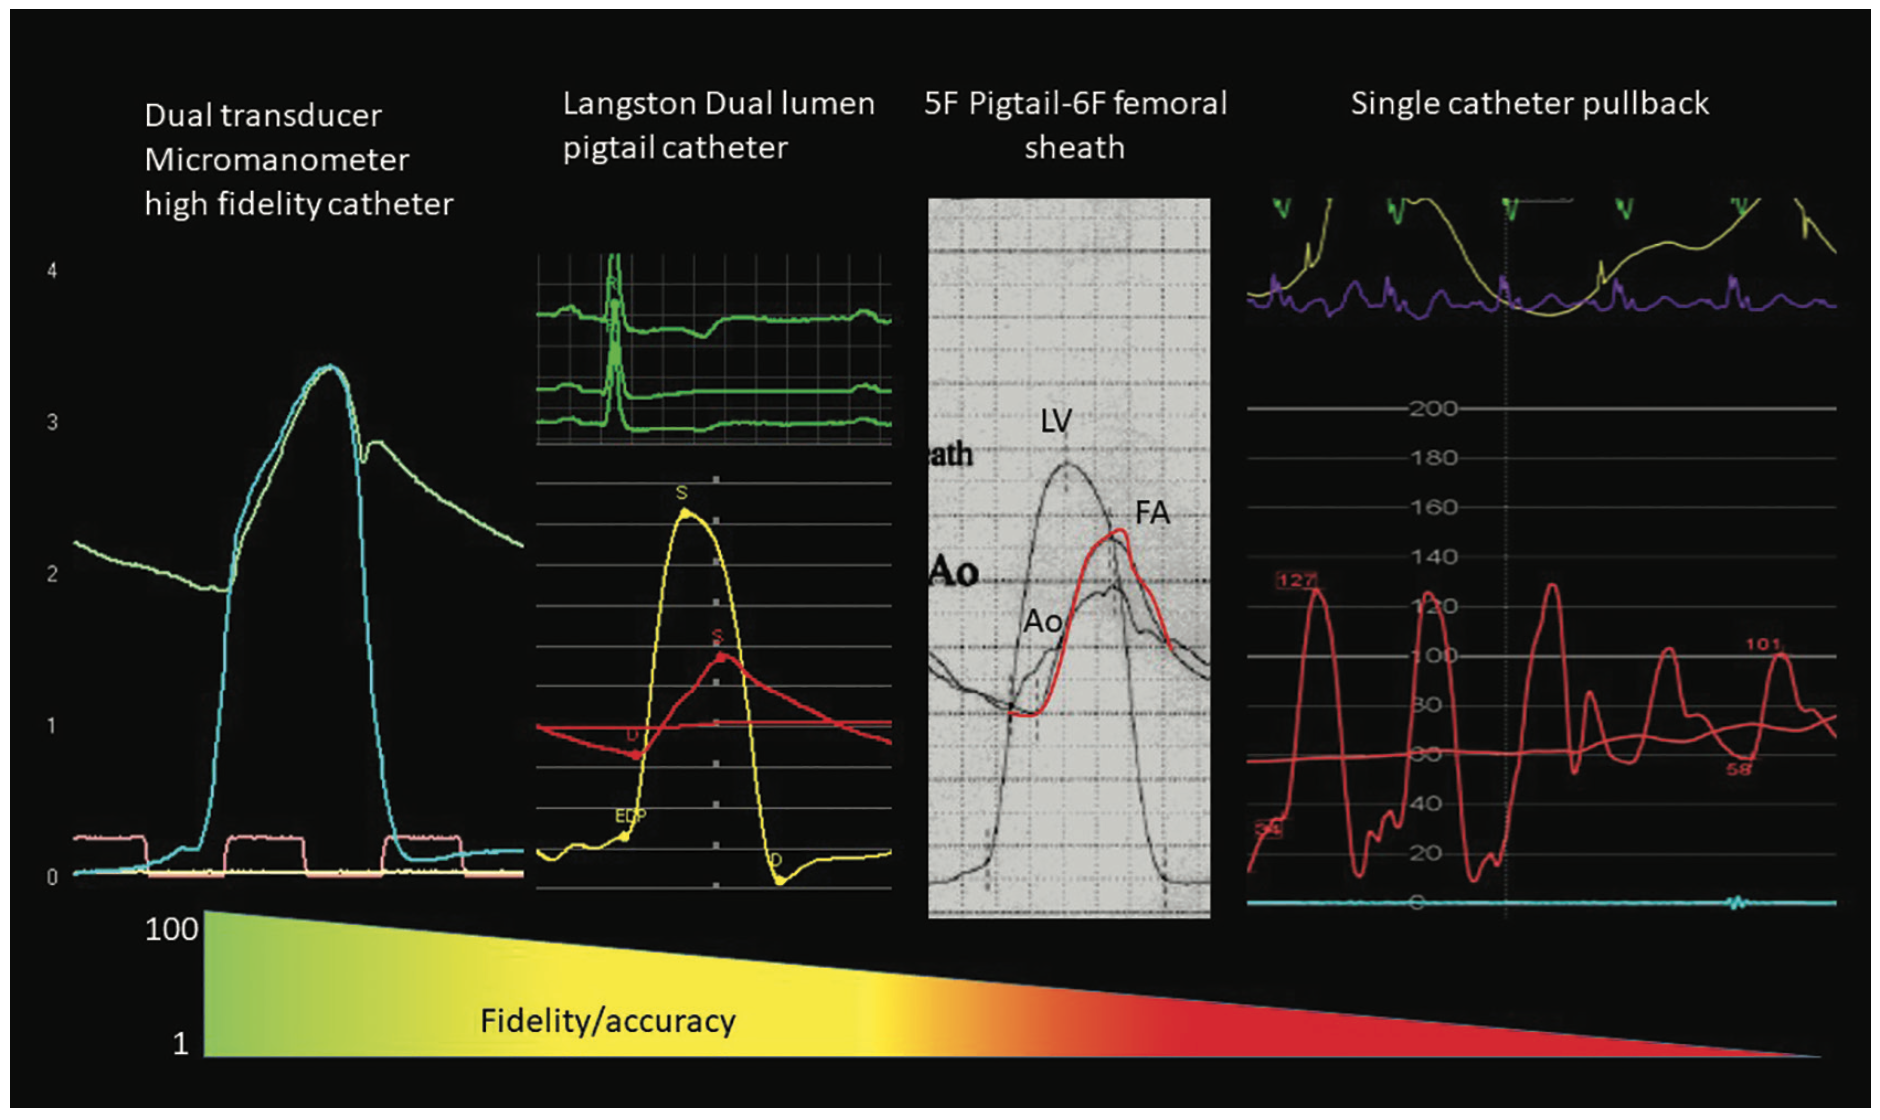
The May 2021 CLD Editor’s Corner on the Langston catheter listed the invasive catheter hemodynamic methods to assess AS from worst to best (Table 1). In brief, the worst but most-used technique (I learned from polling our attendees) was a single pigtail catheter pullback, followed by the mother-in-child variations, and then the pressure wire method (Figure 4). The most accurate method, a dual high-fidelity solid-state transducer catheter, is truly rare, if used at all. My take-home message was that if you think there is a gradient, always check it using good catheter technique. In the cath lab for the fellows’ teaching, I remind them that if you are going to measure it, take the time to do it right.
The Aortic Valve Pressure Loss Versus Flow Curve
Dr. Nils Johnson presented a detailed view of the physiology of the aortic valve, what produces a pressure gradient, and how different configurations of the aortic valve make it difficult to predict the hemodynamic response to stress-induced flow increase (eg, during exercise or dobutamine).
To review basic concepts, a pressure gradient (ΔP) across any valve or artery stenosis is a function of friction (ie, resistance) to flow and energy required to reconstitute laminar flow (ie, energy loss of flow separation) using the following equation:
ΔP=f*Q+s*Q2
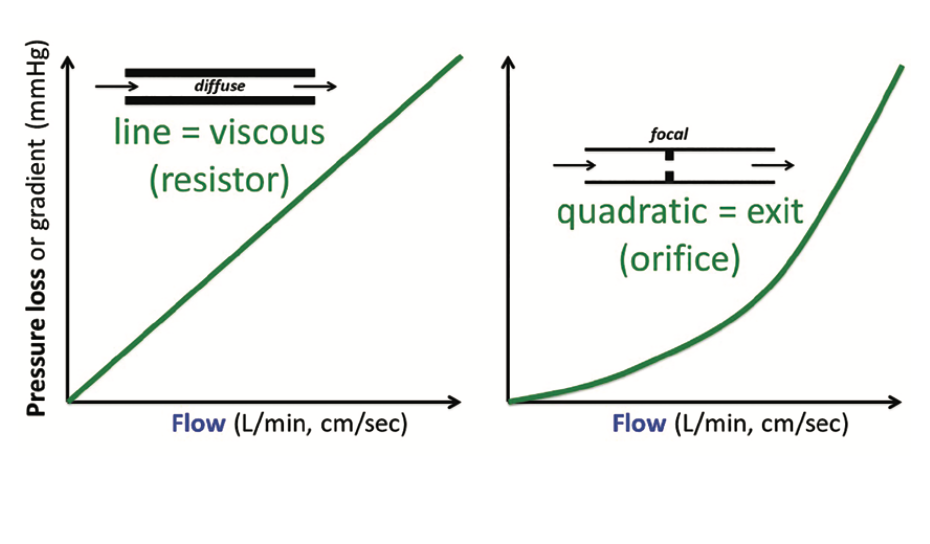
The first term describes linear viscous friction (and its coefficient relates to the “resistance”) while the second quadratic term describes an orifice (and its coefficient relates to the “area”) (Figure 5). Dr. Johnson discussed how the Gorlin aortic valve formula was developed. A quick recap: Dr. Richard Gorlin and his father used an orifice model of the mitral valve to derive the now-famous valve area formulas for both the mitral valve (from 12 experiments) and the aortic valve. Of interest, the Gorlins extended their formula to the aortic valve, assuming it had the same orifice behavior as the mitral valve. No experimental data was ever published for the stenotic aortic valve in this initial work.
Reprinted with permission from Johnson NP, Eur Heart J. 2018 Jul 21;39(28):2646-2655. Copyright ©2018, Oxford University Press.
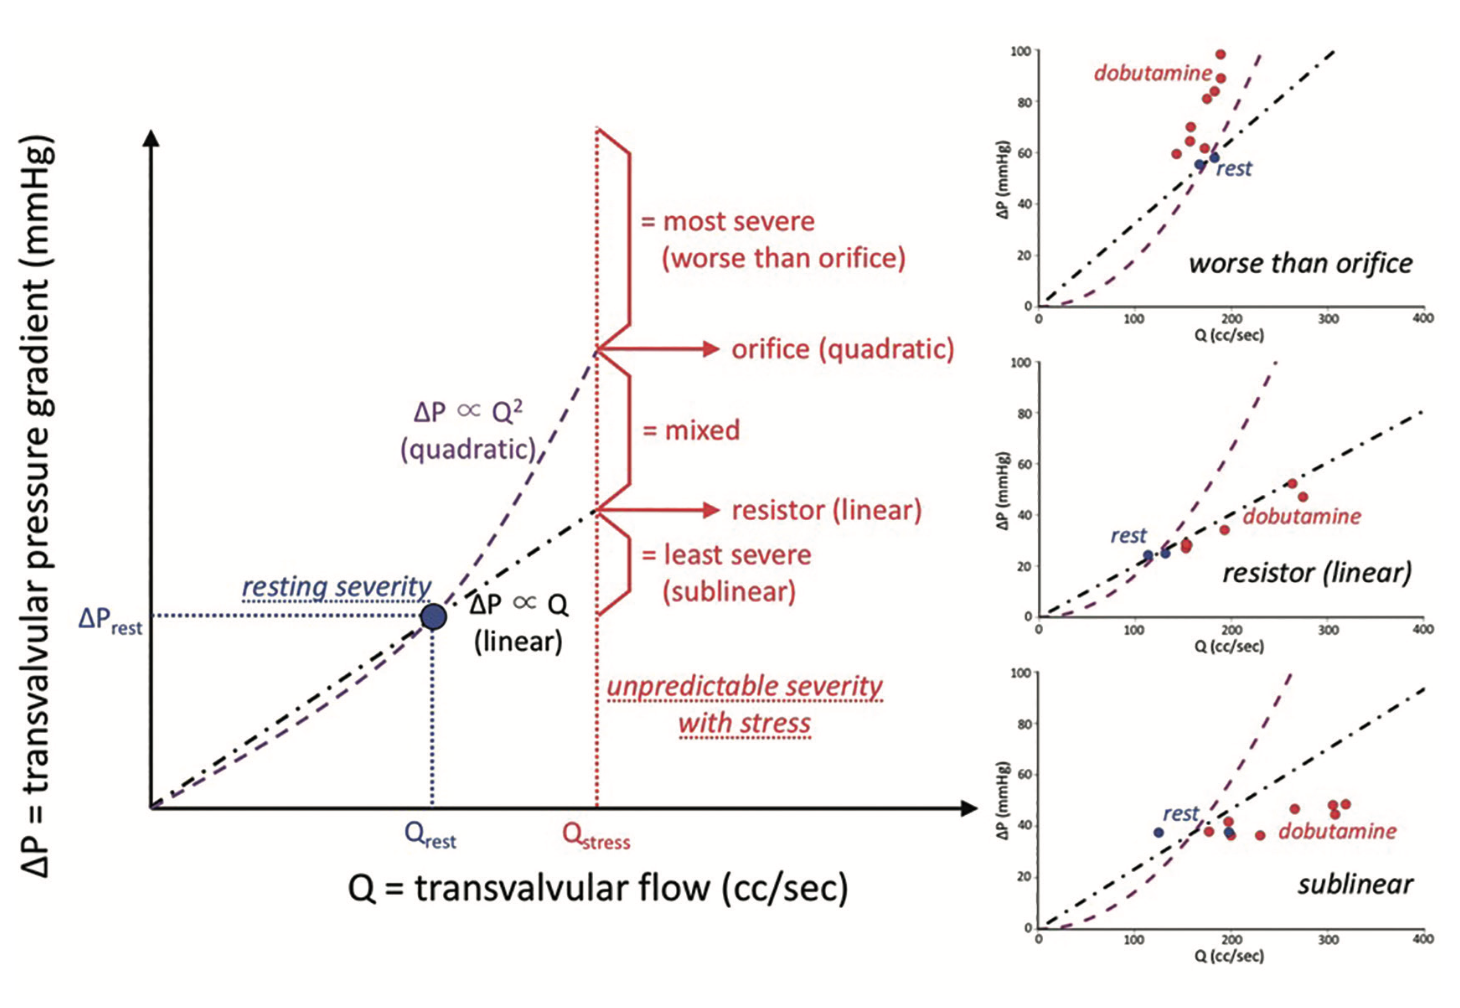
What does the shape of the pressure loss versus flow curve mean to our assessment of a stenotic valve? Human studies using pressure wires demonstrate a wide variety of shapes in patients with severely stenotic valves (Figure 6), with few valves behaving like an orifice (to quote Johnson4, “mean transvalvular pressure loss (ΔP) did not display a consistent relationship with transvalvular flow (Q)...whereas few cases (20%) behaved like an orifice or worse, a large majority of cases (67%) fit a linear or sublinear pattern.”) In contrast, after transcatheter aortic valve replacement (TAVR), the new aortic valve acts like a resistor. An emerging idea from this work is that aortic valve “area” — while deeply embedded in practice and often measured using a variety of techniques — does not provide a valid physiologic description of either diseased or normal aortic valves.
Where Should We Measure the Aortic Pressure in the Aortic Stenosis Patient?
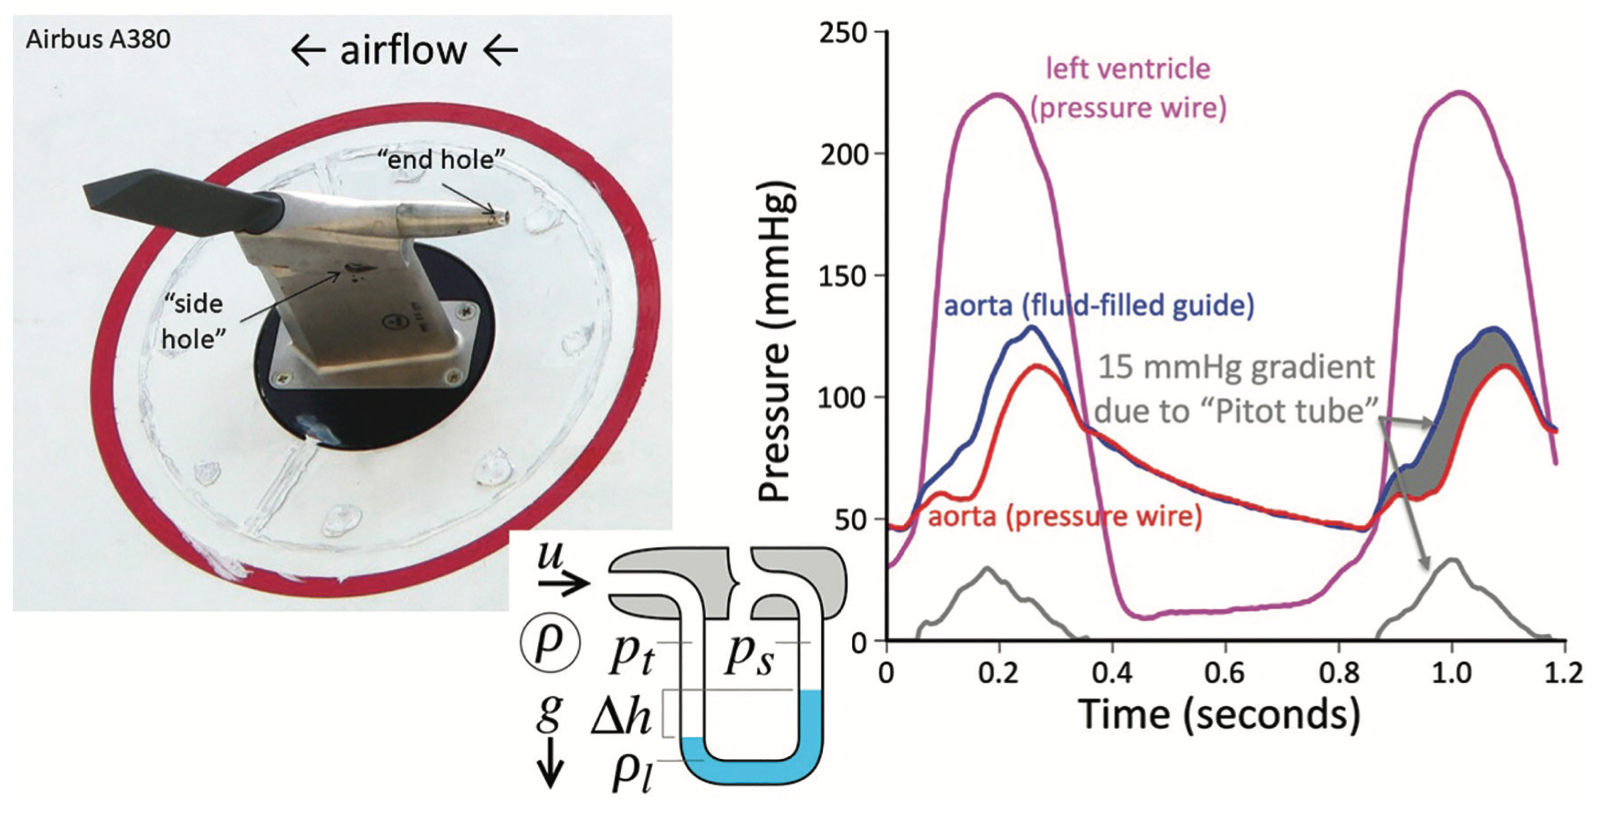
Image reprinted under Creative Commons Public License (https://creativecommons.org/licenses/by-sa/3.0/) from https://en.wikipedia.org/wiki/Pitot_tube. Note: Text notations are by the author.
(Right panel) LV pressure with pressure wire through a 6 French guide catheter that has a second pressure wire in the aorta at the high velocity jet of aortic stenosis. Note the difference between the 2 aortic pressures with the pressure directly in the jet higher than in the area of the aortic outside the jet, demonstrating the Pitot tube effect.
Reprinted with permission from Johnson DT et al. Catheter Cardiovasc Interv. 2020 Sep 1;96(3):E268-E277.
We routinely measure aortic pressure some distance from the stenotic orifice. Dr. Johnson asked us, exactly where should we measure the aortic pressure in the AS patient for optimal results? Should it be close to the valve orifice? 1-2 cm away? >15 cm away? Dr. Johnson showed us a Pitot tube, used to gauge the pressure and speed of jet airplanes (Figure 7). The pressure in the very tip of the tube is higher than pressure measured at some distance from the orifice due to pressure recovery. Similarly, we should be measuring aortic pressure farther away from the valve, near the brachiocephalic trunk. Keep in mind that moving further from the central aortic position, reflected waves begin to summate and produce higher pressure, artificially lowering the true LV-Ao gradient.
Discrepancies Between Echo and Cath LV-Ao Gradients
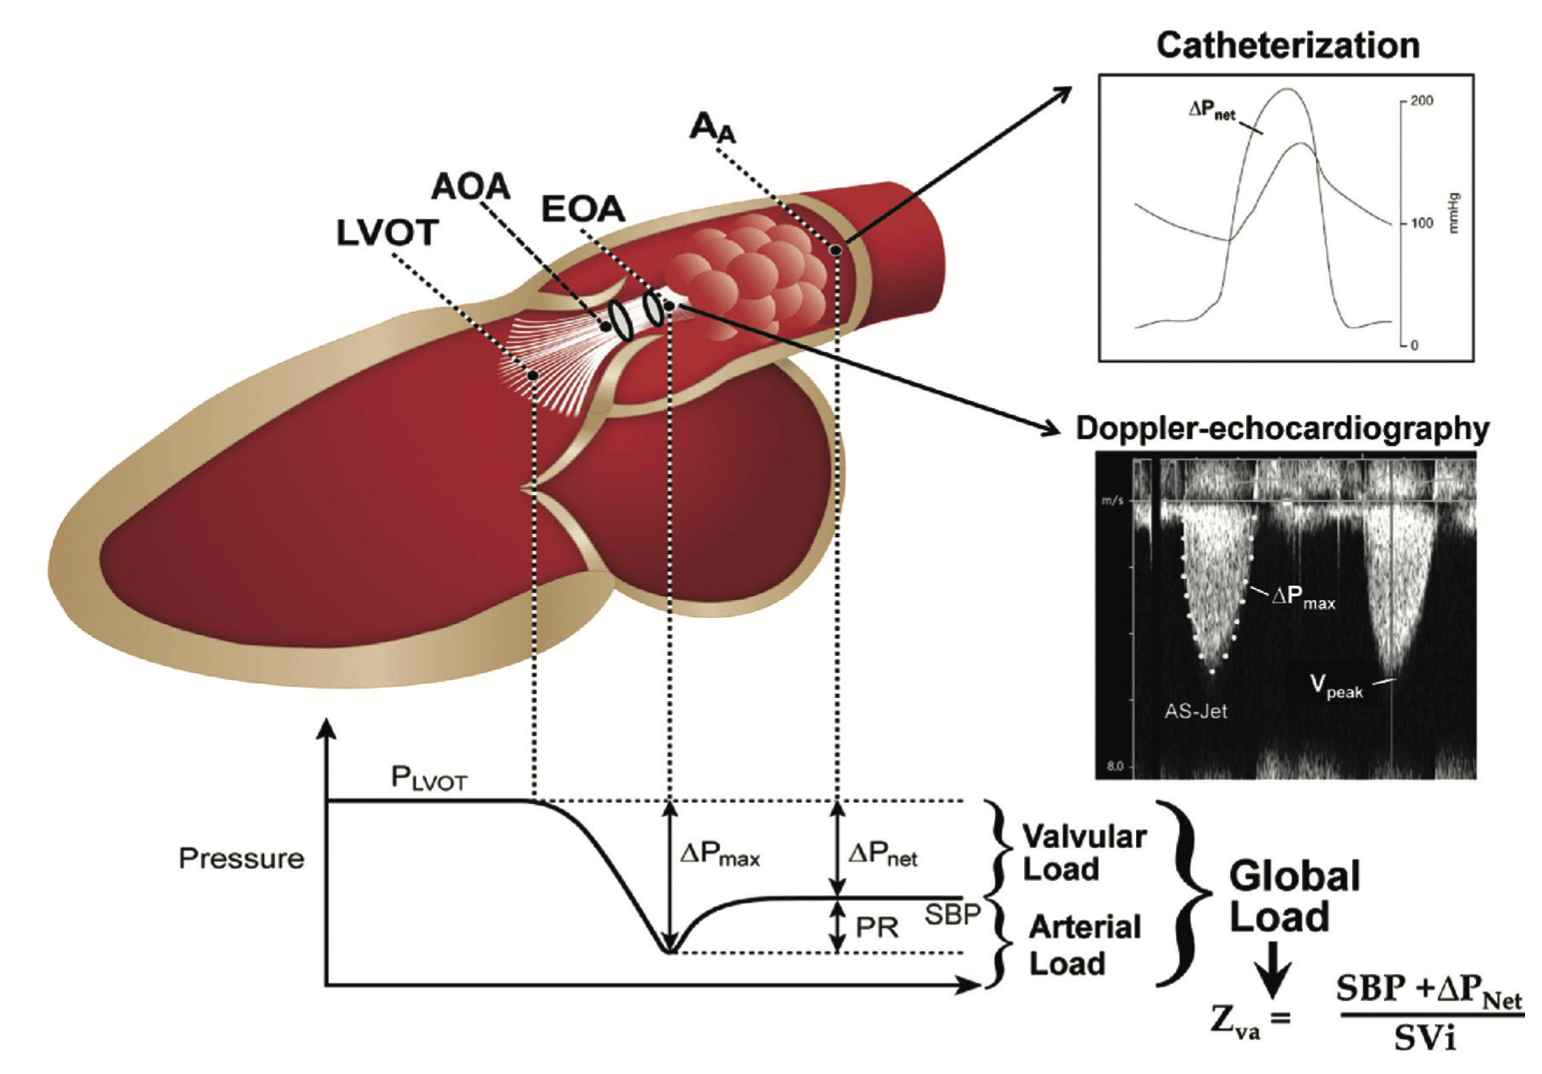
Reprinted with permission from Pibarot P, Dumesnil JG. Improving assessment of aortic stenosis. J Am Coll Cardiol. 2012 Jul 17;60(3):169-80.
Dr. Geraldine Ong, an echocardiographer from Toronto, shared her views on why we have discordant data for AS assessments. While a full lecture course by itself, we know that measurement variability of the echo planes used to measure LVOT, the velocity envelope, and stroke volume, among several other potential sources of error, contribute to the conundrums associated with AS severity at odds with clinical presentations (Figure 8). These issues are the subject for a future editor’s page.
The Bottom Line
In our current era of TAVR and other structural heart interventions, we in the cath lab should provide our colleagues and patients with the highest quality hemodynamic assessment of the aortic valve possible. The indications for invasive assessment of AS are clear, as are the best practices for measurements. The Langston dual lumen catheter has returned to our labs so that we can provide an accurate, low-cost data set with relative ease. Let’s continue to make hemodynamics really count.
Keep Reading:
Managing Urgency During a Cardiac Cath
How to Diagnose and Treat INOCA
What Should a New Team Member Do on Day 1 in the Cath Lab?
References
1. Kern MJ, et al. The Langston is gone for now (no more dual lumen pigtail for aortic valve assessment). Now what? Cath Lab Digest. 2021 April; 29(4): 6-10. https://www.hmpgloballearningnetwork.com/site/cathlab/content/langston-gone-now-no-more-dual-lumen-pigtail-aortic-valve-assessment-now-what-includes-video-discussion
2. Buller C. Letter to the editor re: Langston® dual lumen catheter reintroduction [with commentary by Kern MJ]. Cath Lab Digest. 2022; 30(9): 41. https://www.hmpgloballearningnetwork.com/site/cathlab/letter-editor-re-langstonr-dual-lumen-catheter-reintroduction
3. Writing Committee Members, Otto CM, Nishimura RA, Bonow RO, et al. 2020 ACC/AHA guideline for the management of patients with valvular heart disease: a report of the American College of Cardiology/American Heart Association Joint Committee on Clinical Practice Guidelines. J Am Coll Cardiol. 2021 Feb 2; 77(4): e25-e197. doi: 10.1016/j.jacc.2020.11.018
4. Johnson NP, Zelis JM, Tonino PAL, et al. Pressure gradient vs flow relationships to characterize the physiology of a severely stenotic aortic valve before and after transcatheter valve implantation. Eur Heart J. 2018 Jul 21; 39(28): 2646-2655. doi: 10.1093/eurheartj/ehy126
Disclosures: Dr. Morton Kern reports he is a consultant for Abiomed, Abbott Vascular, Philips Volcano, ACIST Medical, and Opsens Inc.
Dr. Kern can be contacted at mortonkern2007@gmail.com
On Twitter @drmortkern