
Validation of a New Non-Hyperemic Physiological Index: The Constant-Resistance Ratio (cRR)
© 2024 HMP Global. All Rights Reserved.
Any views and opinions expressed are those of the author(s) and/or participants and do not necessarily reflect the views, policy, or position of the Journal of Invasive Cardiology or HMP Global, their employees, and affiliates.
Abstract
Objectives. The instantaneous wave-free ratio (iwFR) has limited availability. A new resting index called the constant-resistance ratio (cRR), which dynamically identifies cardiac intervals with constant and minimum resistance, has been developed; however, its diagnostic performance is unknown. The aim of this study was to validate the cRR by retrospectively calculating the cRR values from raw pressure waveforms of 2 publicly available datasets and compare them with those of the iwFR.
Methods. Waveform data from the CONTRAST and VERIFY 2 studies were used. The primary endpoint was Bland–Altman bias between cRR and iwFR. Secondary endpoints included diagnostic agreement, correlation, receiver operating characteristic (ROC) analysis, and success rates of cRR and iwFR.
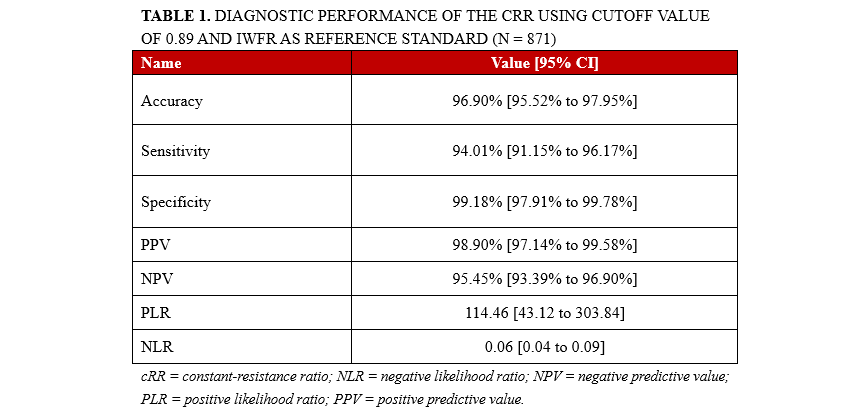
Results. Among the 1036 waveforms, 871 were successful in determining paired cRR and iwFR values, while cRR was 6% more successful than iwFR (P < .0001). The mean bias between cRR and iwFR was 0.003, with 95% limits of agreement [-0.021,0.028]. These 2 indices were highly correlated (r = 0.991; P < .0001). Using an iwFR of 0.89 or less as the reference standard, the optimal cRR cutoff was 0.89, with an area under the ROC curve of 0.991 (P < .001) and a diagnostic accuracy of 96.9% (95% CI [96%, 98%]).
Conclusions. The cRR, a new resting index for identifying dynamic cardiac intervals with constant and minimum resistance, demonstrated high numerical agreement, diagnostic consistency, and a higher success rate than the iwFR based on the 2 publicly available datasets.
Introduction
Accurately determining the functional severity of coronary lesions is essential for procedural planning of percutaneous coronary intervention (PCI). The effectiveness of physiology-guided PCI has been supported by a series of large-scale randomized clinical trials (RCTs)1-3 pivoting fractional flow reserve (FFR), as acknowledged by several international guidelines.4-7 However, the current global uptake of FFR remains suboptimal.8 Potential reasons may include operator skepticism of physiologic guidance,9, 10 suboptimal device-handling characteristics, or vasodilator-related issues (eg, availability or expense).
As the first subcycle resting index, the instantaneous wave-free ratio (iwFR) has established its non-inferiority to FFR in guiding PCI,11-13 which has greatly encouraged the development of other non-hyperemic pressure ratios (NHPRs) such as the diastolic pressure ratio (dPR),14 the diastolic hyperemia-free ratio (DFR),15 and the resting full-cycle ratio (RFR).16 The NHPR algorithms are mutually independent; however, they show strong, universal agreement with the iwFR.17, 18 Furthermore, a recent retrospective analysis showed that some subsequent NHPRs have similar prognostic implications for vessel-related events to the iwFR.19
Despite this, theoretical ambiguity remains. First, the published iwFR algorithm uses a fixed diastolic period (25% past the dicrotic notch to 5 ms before the end of diastole) instead of resorting to the wave-intensity analysis-defined “wave-free period,”20 which appears to be intended to empirically streamline the programming. Second, the reason for the RFR’s location within the systole in 12.2% of the studied cases is yet to be clarified.16 Finally, the underlying reason for replacing the “wave-free period” with a flat dP/dt period in dPR requires further discussion.21 Despite these scientific concerns, iwFR remains unavailable in many centers in China, including ours (at least until completion of this study). Therefore, a new NHPR must address the above gaps by demonstrating a clear ability to stratify lesion severity robustly, which has already been established for FFR and iwFR.20, 22 If this is achieved, the new NHPR may achieve higher clinical merit and facilitate higher physiological adoption.
In this study, we introduce a new resting index: the constant-resistance ratio (cRR; Insight Lifetech). We aimed to validate this index by retrospectively calculating the cRR values from raw pressure waveforms collected from the CONTRAST and VERIFY 2 studies23, 24 and comparing these results with those of the iwFR.
Methods
Study design. This study was a retrospective analysis based on publicly available datasets containing raw, phasic pressure tracings, and their corresponding iwFR values from the CONTRAST and VERIFY 2 studies;23, 24 cRR values were re-calculated based on the same set of iwFR tracings. The flowchart of this study is shown in Figure 1. Repeated resting tracings in these 2 studies permitted the analysis of immediate test-retest repeatability for the cRR. The primary endpoint was the Bland–Altman bias between the cRR and iwFR. The secondary endpoints included diagnostic agreement, correlation, receiver operating characteristic (ROC) analysis, consistency of the 2 cRR measurements, and calculation success rates of the 2 indices. The original studies were approved by the institutional review boards of each participating center, and patients provided written informed consent at the time of enrollment. Because only public and anonymous pressure tracings containing no individual identifiers were used, no additional ethical review was needed.
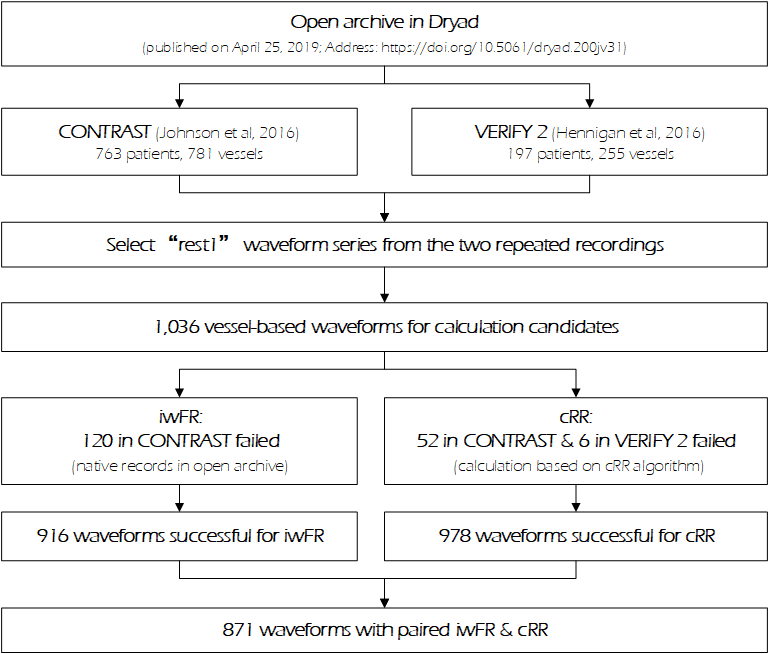
Patient selection. The original open data archive from the CONTRAST (based on the PressureWire Certus; St Jude Medical) and VERIFY 2 (based on the Volcano Prestige or Verrata; Philips Volcano) studies contains repeated iwFR measurements, and the “rest 1” series was selected (Figure 1). The general inclusion and exclusion criteria for the 2 studies are summarized in the Supplemental Figure, and patient demographics were recorded in the original publications.23, 24 Waveforms that could not provide valid cRR or iwFR values were excluded. Both valid iwFR (as the open archive provided) and the determined cRR for the same waveform were further compared (Figure 1).
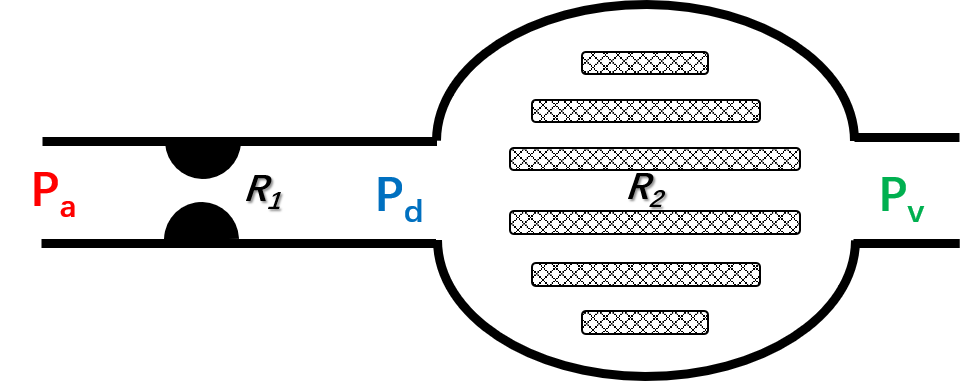
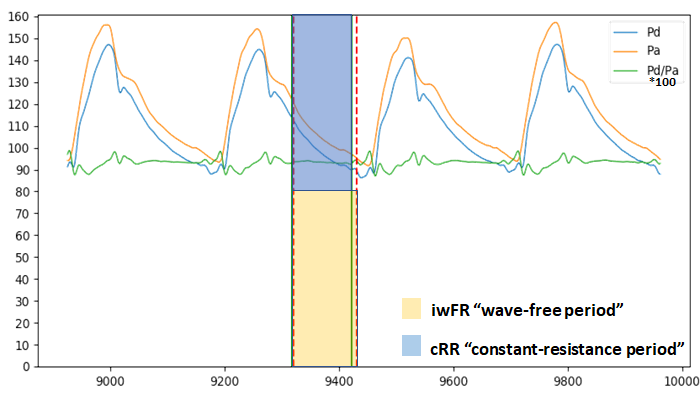
Constant-resistance period determination and cRR calculation. As confirmed in the ADVISE study, myocardial resistance remains minimal and constant during a specific period of the resting cardiac cycle.20 During this period, with minimal and constant resistance at a given perfusion pressure, the coronary artery blood flow rate reached its peak level without the administration of the vasodilator. According to fundamental physics, the flow rate of the coronary artery should be conserved. According to Poiseuille’s law:
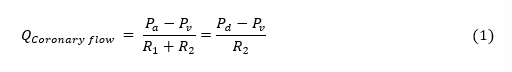
where
Converting (1) to express the relationship between the pressure and resistance ratios yields:
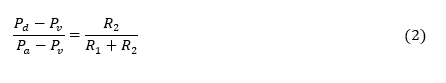
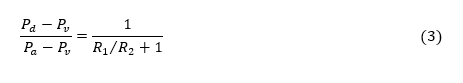
and rewriting (2) as:
Physiologically,
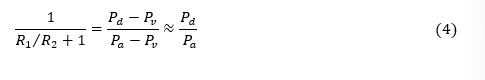
According to (4), if
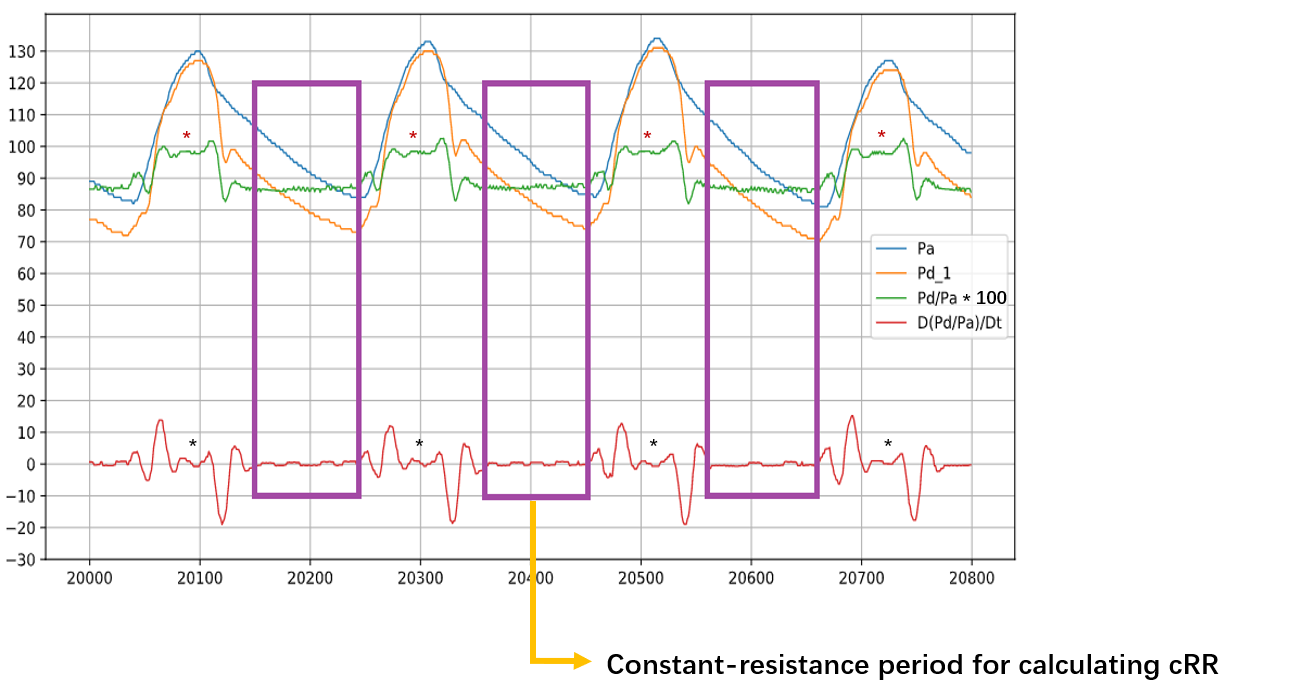
Algorithmically, 2 gatekeeping processes were also implemented. First, in the same cardiac cycle, more than 1 interval with constant Pd/Pa was simultaneously discovered on the initial attempt (eg, intervals marked by asterisks and purple rectangles within the same cycle [Figure 3]). However, recalling (4) given that the resistance is at the minimum for the resting period, the algorithm should seek and identify the one with the lower/lowest Pd/Pa (ie, the one marked by the purple rectangle [Figure 3]); second, each identified constant-resistance period would be the cRR candidate only if it occupies a reasonably sufficient portion of the cardiac cycle (for the method in this study, one-eighth of the cycle), while those that were insufficient are disregarded as an attempt to extract the interested cRR intervals while simultaneously enabling smartly-adapting arbitrary cycle lengths. As a result, cRR was defined as the average Pd/Pa value within the constant-resistance periods selected by the above method in 5 consecutive resting cardiac cycles. The cRR reading was performed by the investigators using a dedicated package (FFR-cRR Viewer ver. 1.0.0.0; Insight Lifetech), which was modified for cRR processing in addition to its original offline reviewing function.
Data analysis. Statistical analyses and graphical plots were performed using the MedCalc software (version 20.027; MedCalc Software). Linear relationships between the indices were assessed using Pearson’s correlation and Passing–Bablok regression. Agreement was evaluated using a Bland–Altman analysis with corresponding 95% limits of agreement (LoA). Test-retest stability was evaluated using intraclass correlation. ROC curve analysis and the corresponding area under the curve (AUC) were used to assess diagnostic performance, and the Youden index was used to determine the optimal cRR cutoff. The success rates of the iwFR and cRR calculations were compared using McNemar’s test at the level of the pooled cohort (CONTRAST + VERIFY 2) and the cohort of each individual study (CONTRAST or VERIFY 2). Continuous variables are presented as mean ± standard deviation (SD), and statistical significance set at P < .05.
Results
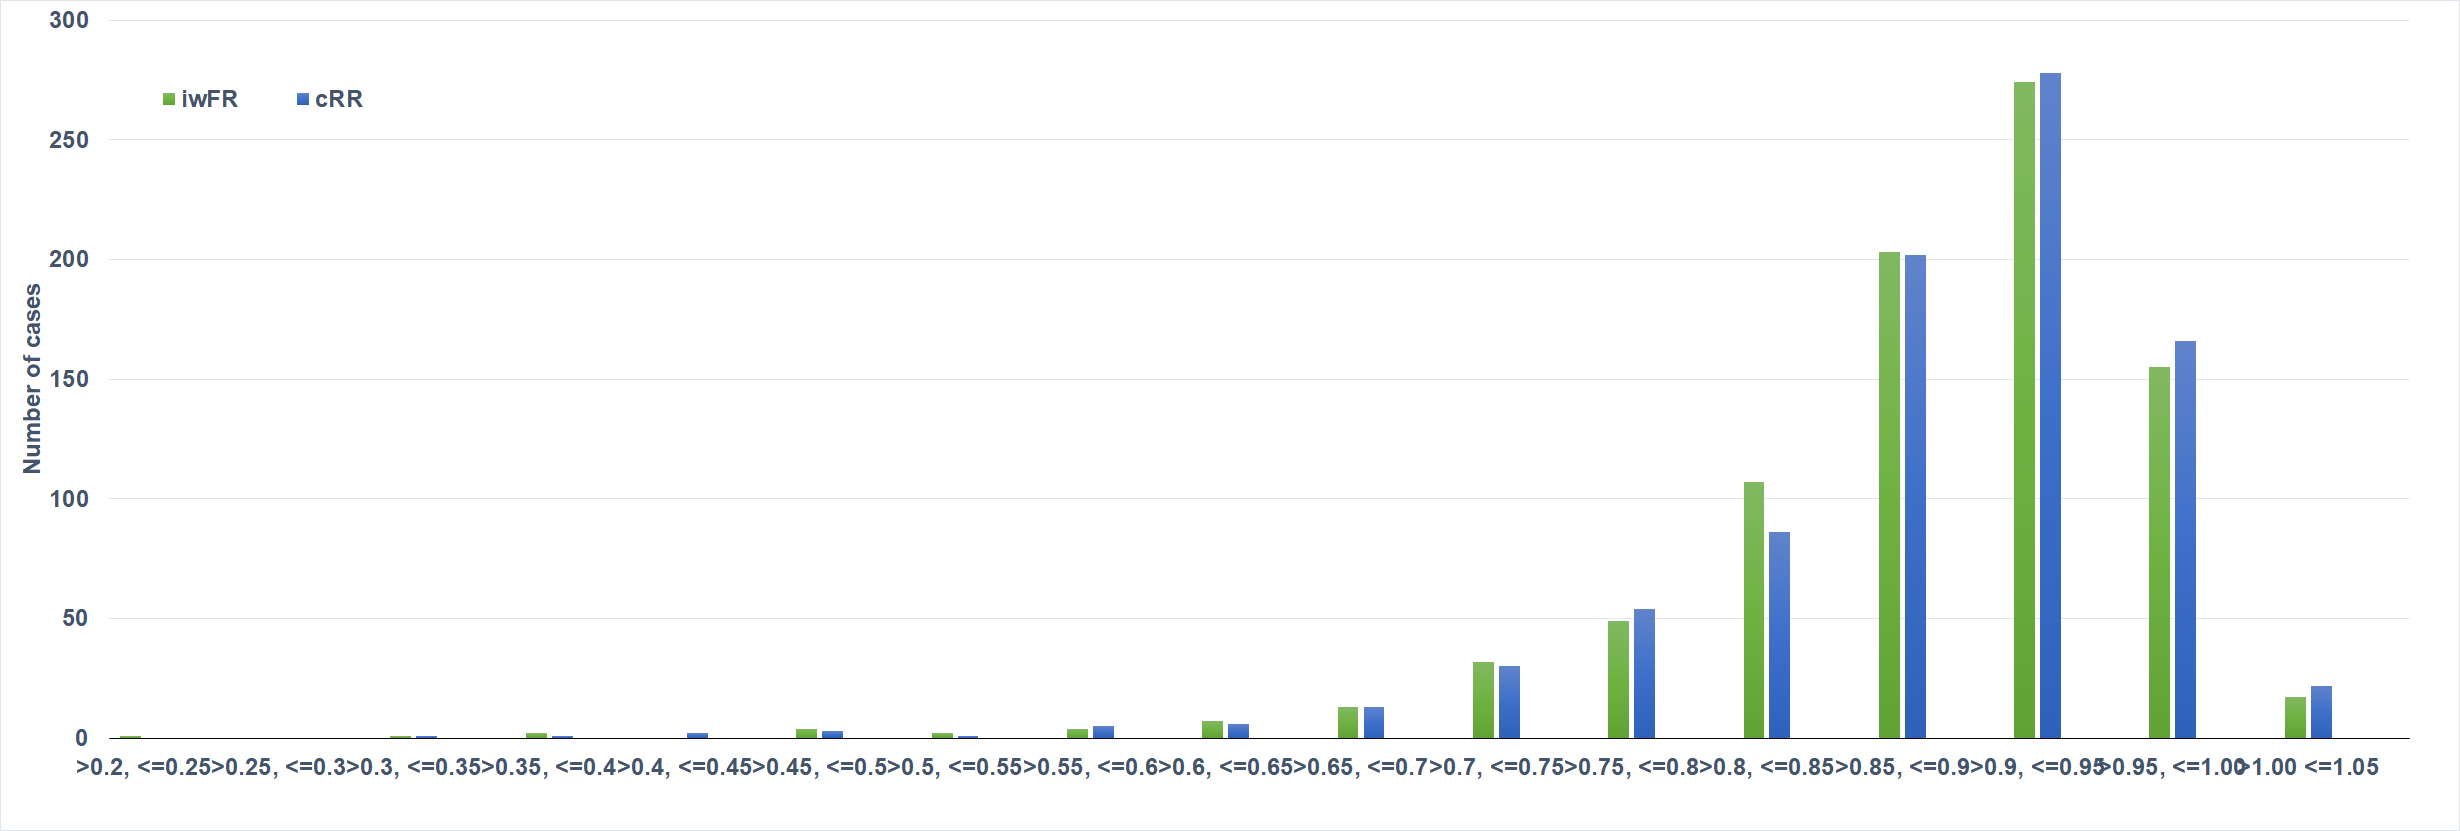
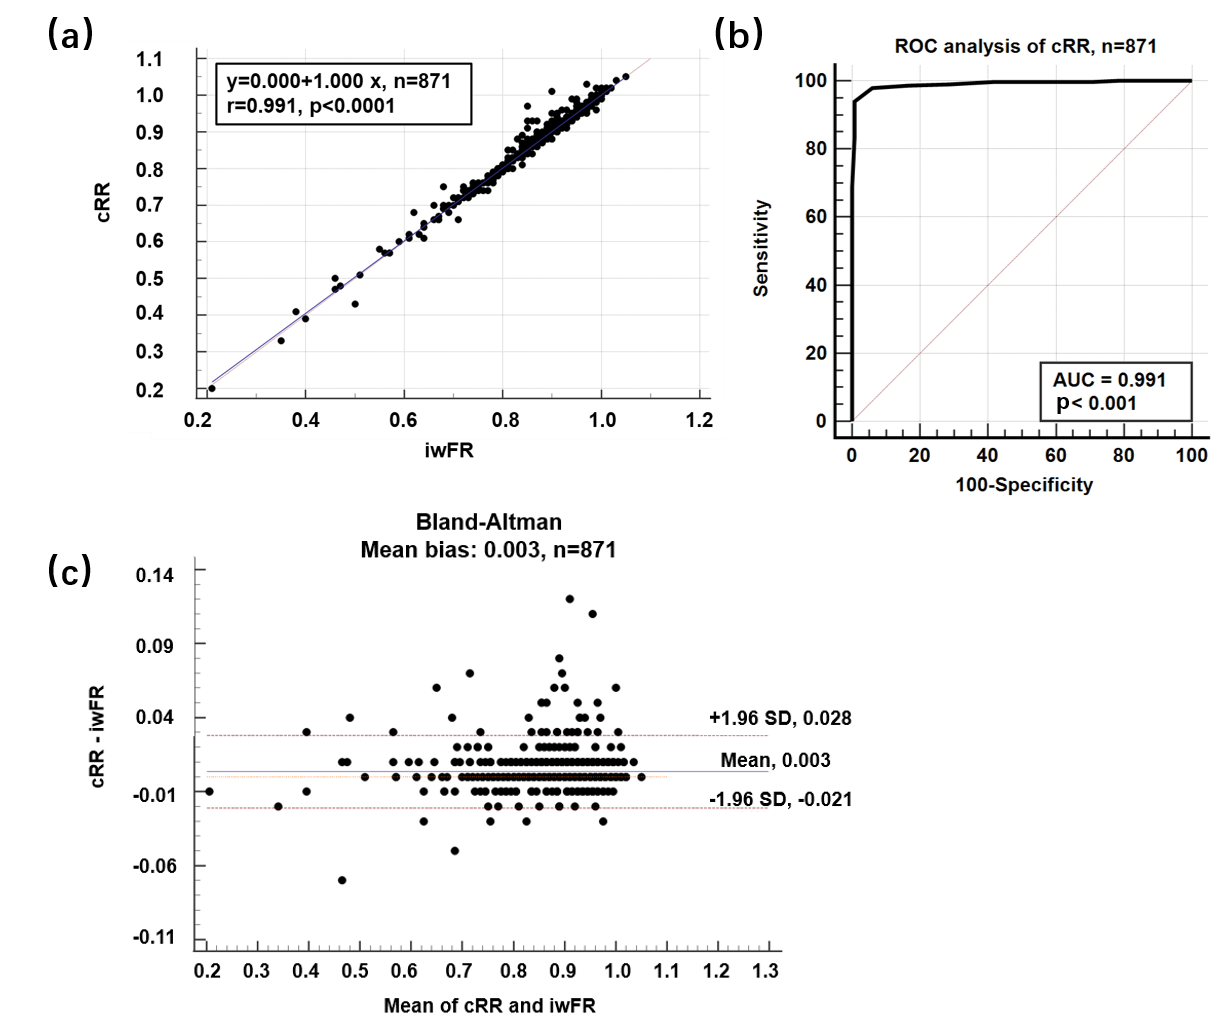
Agreement between iwFR and cRR. By selecting “rest 1” series in the open archive, there were 1036 waveforms (Figure 1). A total of 871 resting waveforms successfully identified both iwFR and cRR and were utilized for the validation of agreement (Figure 1). The mean iwFR and cRR were 0.89 ± 0.09 and 0.89 ± 0.09, respectively, with similar distribution profiles (Figure 4). Pearson’s correlation and Passing–Bablok regression (Figure 5A) showed excellent correlation (r = 0.991) and a strong linear relationship. ROC analysis using an iwFR of
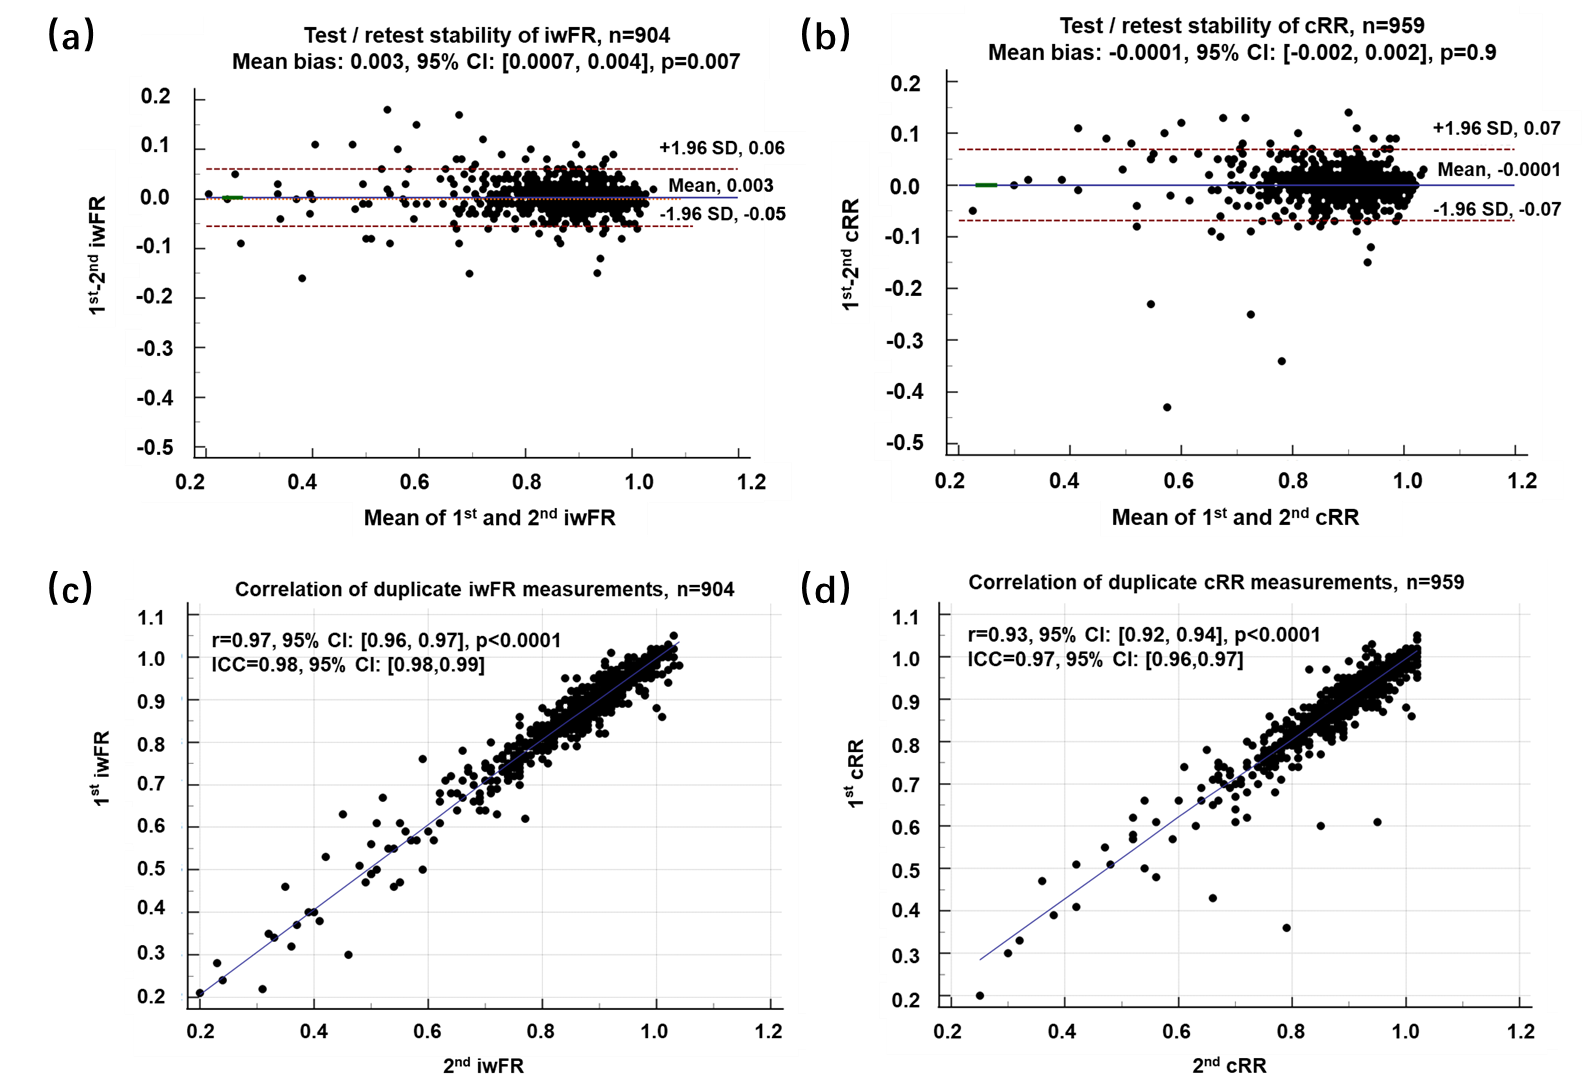
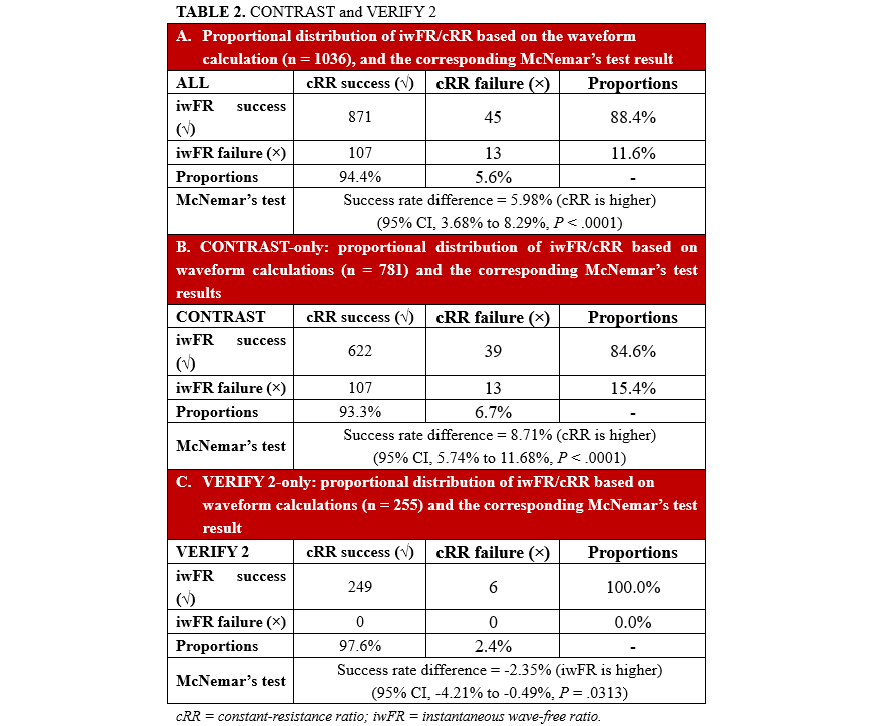
Algorithm stability and calculation success rates. Figure 6 shows the repeatability of the 2 resting indices. In both the CONTRAST and VERIFY 2 studies, 2 sequential resting measurements were conducted in each vessel. The mean bias between the 2 iwFR measurements was 0.003 with a 95% LoA of [-0.05, 0.06]. The mean bias between the 2 cRR measurements was only -0.0001, which was numerically smaller than that of the iwFR with a 95% LoA of [-0.07, 0.07] (Figure 6A and B). The paired values are shown in the scatter plots in Figure 6C and D. Pearson’s correlation coefficient of the 2 iwFRs was 0.97 (95% CI, [0.96, 0.97], P < .0001) and 0.93 for 2 cRRs (95% CI, [0.92, 0.94], P < .0001); the intraclass correlation coefficients of cRR and iwFR were 0.97 (95% CI, [0.96, 0.97]) and 0.98 (95% CI, [0.98, 0.99]), respectively. Among the original 1036 waveforms, ahead of the paired comparison, the cRR calculation success rate was almost 6% higher than that of the iwFR, with statistical significance (P < .0001, Table 2A). Regarding only CONTRAST tracings, the cRR success rate was 8.7% higher than that of iwFR (P < .0001, Table 2B), whereas in terms of VERIFY 2-only waveforms, cRR was 2.4% less successful than iwFR (P = .03, Table 2C).
Discussion
In this post-hoc analysis, we demonstrated the feasibility of cRR as a new resting index for equivalent physiological assessments using iwFR as the reference standard. The cRR index was retrospectively verified using data from 2 previous studies, and the main findings were as follows: (1) Bland–Altman analysis showed that the average bias between cRR and iwFR was minimal; (2) for immediately-repeated measurements, the variation between cRR was numerically smaller than that of iwFR, indicating that cRR agrees with iwFR, at least to the extent that iwFR agrees with itself; (3) cRR and iwFR were highly interchangeable in binary diagnosis; and (4) cRR demonstrated a higher success rate based on the 1036 tracings retrospectively analyzed.
In general, resting indices show an accuracy of approximately 80% compared with FFR.25 If compared mutually, their accuracies are above 90%, which is not significantly different from the cases that are compared with iwFR.17, 18 A binary threshold of a cRR of 0.89 or less achieved an accuracy of 96.9% with high sensitivity, specificity, and promising positive and negative predictive values using iwFR as a reference (Table 1). This indicates that the diagnostic performance of cRR may also be equivalent to that of other NHPRs17, 18 as evidenced by the mean bias between cRR and iwFR being as low as 0.003 in the 871 cases.
In the current dataset, the cRR success rate was 6% significantly higher than that of iwFR (Table 2A). Further investigation of the cRR and iwFR success rates in the individual CONTRAST and VERIFY 2 cohorts showed that the 6% overall difference was mainly driven by CONTRAST (Table 2B and C). Since the iwFR values in CONTRAST were also retrospectively calculated,24 this seems to indicate that the offline calculation of cRR outperformed the iwFR offline package historically used in CONTRAST.
It is highly probable that the findings in this study are related to the difference between iwFR and cRR; iwFR indiscriminately requires recognition of the “wave-free period” as the period from 25% past the dicrotic notch to 5 ms before the end of diastole,20 while cRR is concluded only from resting periods that are algorithmically-determined with constant and minimum resistance. It should be acknowledged that the contemporary iwFR has been iterated for generations, even after the publication of the electrocardiogram-independent algorithm (equal to the original in terms of waveform processing);20, 26 therefore, the stored iwFR values in the open archive that were used for comparison with cRR represent a slice of history.
Comparison with the latest iwFR (or other available, developed NHPRs) and/or the investigation into the procedural impact of any mismatches will likely generate more clinical implications. In fact, 2 more adequately powered trials, SUPREME II (Clinicaltrials.gov #NCT05417763) and INSIGHTFUL-FFR (Clinicaltrials.gov # NCT05437900), were prospectively designed to investigate cRR. In SUPREME II, cRR guidance was investigated in a catheterization laboratory setting comparing the guidance by RFR (at the trial initiation), while the INSIGHTFUL-FFR trial is designed to compare the clinical outcomes between pressure microcatheter-guided (including cRR) and pressure wire-guided strategies.
Limitations. This study was a post-hoc analysis of publicly available data from which cRR was retrospectively calculated based on the given tracings instead of being measured on-site. However, part of the publicly available iwFR values were also retrospectively calculated. The pressure waveforms from the CONTRAST and VERIFY 2 studies may have been affected by the heterogeneity of the different pressure wires. In the original CONTRAST study, the core lab excluded some waveforms,24 while similar screening by the core lab was not applied to the open archive.15 Drift evaluation was not performed because of the lack of such data in the open archive. The publicly available waveforms were recorded at rest only; hence, a comparison between the cRR and FFR was not feasible. The retrospective offline calculation was performed without blinding. However, because the open iwFR tracings had only 5 cycles for each vessel, such an impact should be minimal. The online diagnostic performance of cRR was also not feasible in this post-hoc analysis, as such investigations were already the endpoints of other trials, such as SUPREME II and INSIGHTFUL-FFR.
Conclusions
This study proposed and validated a novel resting index, the cRR, for identifying arbitrary cardiac periods at rest, wherein myocardial resistance is constant and minimal. The dicrotic notch identification-independent cRR index demonstrated minimal numerical bias and a high diagnostic agreement. Additionally, the cRR achieved a significantly higher success rate in offline calculations than the iwFR (at least for its version used in CONTRAST). Given that the iwFR remains relatively limited in many centers (and ours so far), the cRR represents an alternative assessment to physicians.
Affiliations and Disclosures
From the 1Department of Cardiology, Zhongshan Hospital, Fudan University, Shanghai, China; 2Department of Equipment and Materials, Zhongshan Hospital, Fudan University, Shanghai, China; 3Insight Lifetech Co. Ltd., Shenzhen, China; 4Department of Medicine and Therapeutics, Faculty of Medicine, The Chinese University of Hong Kong, Hong Kong, China; 5Cardiovascular Research Center Aalst, OLV Hospital, Belgium; 6University of Naples Federico II, Italy; 7Weatherhead PET Center, Division of Cardiology, Department of Medicine, McGovern Medical School at UTHealth, Houston, Texas, USA; 8Memorial Hermann Hospital, Houston, Texas, USA; 9Cardiology Department, Golden Jubilee National Hospital, Glasgow, United Kingdom; 10The University of Glasgow, Glasgow, United Kingdom.
Dr Li and Dr J Wu contributed equally to this work.
Acknowledgments: The authors would like to thank all the participating patients and investigators/colleagues in the CONTRAST and VERIFY 2 studies, especially those who made the waveforms publicly available.
Disclosures: The authors report no financial relationships or conflicts of interest regarding the content herein.
Address for correspondence: Junbo Ge, MD, PhD, Department of Cardiology, Zhongshan Hospital, Fudan University, 180 Fenglin Road, Xu Hui District, Shanghai 200032, China. Email: jbge@zs-hospital.sh.cn
Supplemental Material
References
1. Bech GJW, Bruyne B De, Pijls NHJ, et al. Fractional flow reserve to determine the appropriateness of angioplasty in moderate coronary stenosis: a randomized trial. Circulation. 2001;103(24):2928-2934. doi: 10.1161/01.cir.103.24.2928
2. Tonino PA, De Bruyne B, Pijls NH, et al; FAME Study Investigators. Fractional flow reserve versus angiography for guiding percutaneous coronary intervention. N Engl J Med. 2009;360(3):213-224. doi: 10.1056/NEJMoa0807611
3. De Bruyne B, Pijls NH, Kalesan B, et al; FAME 2 Trial Investigators. Fractional flow reserve-guided PCI versus medical therapy in stable coronary disease. N Engl J Med. 2012;367(11):991-1001. doi: 10.1056/NEJMoa1205361
4. Sousa-Uva M, Neumann FJ, Ahlsson A, et al. 2018 ESC/EACTS Guidelines on myocardial revascularization. Eur J Cardio-Thorac Surg. 2019;55(1):4-90. doi: 10.1093/ejcts/ezy289
5. Knuuti J, Wijns W, Saraste A, et al. 2019 ESC Guidelines for the diagnosis and management of chronic coronary syndromes. Eur Heart J. 2020;41(3):407-477. doi: 10.1093/eurheartj/ehz425
6. Collet JP, Thiele H, Barbato E, et al; ESC Scientific Document Group. 2020 ESC Guidelines for the management of acute coronary syndromes in patients presenting without persistent ST-segment elevation. Eur Heart J. 2021;42(14):1289-1367. doi: 10.1093/eurheartj/ehaa575
7. Lawton JS, Tamis-Holland JE, Bangalore S, et al. 2021 ACC/AHA/SCAI Guideline for coronary artery revascularization: executive summary: a report of the American College of Cardiology/American Heart Association Joint Committee on Clinical Practice Guidelines. J Am Coll Cardiol. 2022;79(2):197-215. doi: 10.1016/j.jacc.2021.09.005
8. Warisawa T, Cook CM, Akashi YJ, Davies JE. Past, present and future of coronary physiology. Rev Esp Cardiol. 2018;71(8):656-667. doi: 10.1016/j.rec.2018.02.003
9. Toth GG, Toth B, Johnson NP, et al. Revascularization decisions in patients with stable angina and intermediate lesions: results of the international survey on interventional strategy. Circ Cardiovasc Interv. 2014;7(6):751-759. doi: 10.1161/CIRCINTERVENTIONS.114.001608
10. Tebaldi M, Biscaglia S, Fineschi M, et al. Evolving routine standards in invasive hemodynamic assessment of coronary stenosis: the Nationwide Italian SICI-GISE Cross-Sectional ERIS Study. JACC Cardiovasc Interv. 2018;11(15):1482-1491. doi: 10.1016/j.jcin.2018.04.037
11. Davies JE, Sen S, Dehbi H-M, et al. Use of the instantaneous wave-free ratio or fractional flow reserve in PCI. N Engl J Med. 2017;376(19):1824-1834. doi: 10.1056/NEJMoa1700445
12. Götberg M, Christiansen EH, Gudmundsdottir IJ, et al; iFR-SWEDEHEART Investigators. Instantaneous wave-free ratio versus fractional flow reserve to guide PCI. N Engl J Med. 2017;376(19):1813-1823. doi: 10.1056/NEJMoa1616540
13. Götberg M, Berntorp K, Rylance R, et al. 5-year outcomes of PCI guided by measurement of instantaneous wave-free ratio versus fractional flow reserve. J Am Coll Cardiol. 2022;79(10):965-974. doi: 10.1016/j.jacc.2021.12.030
14. Van't Veer M, Pijls NHJ, Hennigan B, et al. Comparison of different diastolic resting indexes to iFR: are they all equal? J Am Coll Cardiol. 2017;70(25):3088-3096. doi: 10.1016/j.jacc.2017.10.066
15. Johnson NP, Li W, Chen X, et al. Diastolic pressure ratio: new approach and validation vs. the instantaneous wave-free ratio. Eur Heart J. 2019;40(31):2585-2594. doi: 10.1093/eurheartj/ehz230
16. Svanerud J, Ahn J-M, Jeremias A, et al. Validation of a novel non-hyperaemic index of coronary artery stenosis severity: the resting full-cycle ratio (VALIDATE RFR) study. EuroIntervention. 2018;14(7):806-814. doi: 10.4244/EIJ-D-18-00342
17. Lee JM, Choi KH, Park J, et al. Physiological and clinical assessment of resting physiological indexes: resting full-cycle ratio, diastolic pressure ratio, and instantaneous wave-free ratio. Circulation. 2019;139(7):889-900. doi: 10.1161/CIRCULATIONAHA.118.037021
18. Ahn J, Ali ZA, Svanerud J, et al. IRIS-FFR Registry : Prognostic Performance of Five Resting Pressure- Derived Indexes of Coronary Physiology. Presented at: TCT; September 22, 2018; San Diego, CA.
19. Lee JM, Lee SH, Hwang D, et al. Long-term clinical outcomes of nonhyperemic pressure ratios: resting full-cycle ratio, diastolic pressure ratio, and instantaneous wave-free ratio. J Am Heart Assoc. 2020;9(18):e016818. doi: 10.1161/JAHA.120.016818
20. Sen S, Escaned J, Malik IS, et al. Development and validation of a new adenosine-independent index of stenosis severity from coronary wave-intensity analysis: results of the ADVISE (ADenosine Vasodilator Independent Stenosis Evaluation) study. J Am Coll Cardiol. 2012;59(15):1392-402. doi: 10.1016/j.jacc.2011.11.003
21. Ligthart J, Masdjedi K, Witberg K, et al. Validation of resting diastolic pressure ratio calculated by a novel algorithm and its correlation with distal coronary artery pressure to aortic pressure, instantaneous wave-free ratio, and fractional flow reserve. Circ Cardiovasc Interv. 2018;11(12):e006911. doi: 10.1161/CIRCINTERVENTIONS.118.006911
22. Pijls NHJ, Van Son JAM, Kirkeeide RL, De Bruyne B, Gould KL. Experimental basis of determining maximum coronary, myocardial, and collateral blood flow by pressure measurements for assessing functional stenosis severity before and after percutaneous transluminal coronary angioplasty. Circulation. 1993;87(4):1354-67. doi: 10.1161/01.cir.87.4.1354
23. Hennigan B, Oldroyd KG, Berry C, et al. Discordance between resting and hyperemic indices of coronary stenosis severity: The VERIFY 2 Study (a comparative study of resting coronary pressure gradient, instantaneous wave-free ratio and fractional flow reserve in an unselected population referred for invasive angiography. Circ Cardiovasc Interv. 2016;9(11):e004016. doi: 10.1161/CIRCINTERVENTIONS.116.004016
24. Johnson NP, Jeremias A, Zimmermann FM, et al. Continuum of vasodilator stress from rest to contrast medium to adenosine hyperemia for fractional flow reserve assessment. JACC Cardiovasc Interv. 2016;9(8):757-767. doi: 10.1016/j.jcin.2015.12.273
25. Aoun J, Lahsaei S, Zahm C, Bhat T, Carrozza JP. Validation and comparison of non-hyperemic pressure reserve to fractional flow reserve for assessment of coronary artery stenosis: a real world study. Catheter Cardiovasc Interv. 2019;93(2):250-255. doi: 10.1002/ccd.27834
26. Petraco R, Sen S, Nijjer S, et al. ECG-independent calculation of instantaneous wave-free ratio. JACC Cardiovasc Interv. 2015;8(15):2043-2046. doi: 10.1016/j.jcin.2015.10.005