


The Current U.S. Prevalence of Peripheral Arterial Disease
VASCULAR DISEASE MANAGEMENT 2023;20(4):E67-E73
Abstract
Purpose. Few estimates of the U.S. prevalence of peripheral arterial disease (PAD) have been published. The most quoted estimate, 8 million to 12 million (the Criqui/PARTNERS number), was calculated based on the U.S. population circa 1995. However, in the past 28 years, the population has aged and become considerably more diabetic, 2 key risk factors for PAD. The purpose of this study was to calculate a more accurate 2020 PAD prevalence employing the Diabetes Method and to compare PAD prevalence by this method with those of the Criqui/PARTNERS and Nehler methods for 1995 and for the 2010 to 2030 period. Materials and Methods. The Diabetes Method calculates PAD by age and glucose status. Employing U.S. Census Bureau data for 2010 to 2030, the U.S. population was segmented into 2 age groups: 45 to 64 and those 65 and older. Within each of these age groups, the population was divided into the 3 glucose states: diabetes (diagnosed and undiagnosed), prediabetes, and normal. The percent in each age group with diabetes, prediabetes, and normal glucose is found in the 2011-2012 National Health and Nutrition Examination Survey (NHANES) data. For the comparative 1995 calculations, the 1995 U.S. population ages 45 to 64 and 65 and older was segmented into the glucose prevalence reported in the 1988-1994 NHANES. PAD was calculated according to the percentage prevalence in each glucose state. In those 65 and older, we employed the percentage prevalence of PAD in the Cardiovascular Health Study. The percentage prevalence of PAD by glucose status in the 45-to-64 age group was estimated based on a review of the published literature. Results. The number of U.S. citizens with PAD in 1995 and in the 2010 to 2030 period was calculated based on the percentage prevalence by age group in the 1985 Criqui study, the source of the 8 to 12 million estimate, and in those ages 40 and older found in the Nehler study. In 1995, according to the Diabetes Method, 11 million U.S. citizens had PAD. This compares with the 8 to 12 million calculated by the Criqui/PARTNERS method and the 13 million calculated by the Nehler method. By 2020, the Diabetes Method PAD prevalence rose to 21 million. Modifying the Diabetes Method calculations to include a higher prevalence found in recent Medicare data results in an even greater number with PAD, or 26 million. In contrast, the 2020 PAD prevalence was 12 million to 19 million and 19 million calculated by the Criqui/PARTNERS and Nehler methods, respectively. However, for several reasons, the Criqui/PARTNERS and Nehler methods underestimate PAD prevalence. Conclusion. We conclude that current PAD prevalence is significantly higher than commonly stated. At least 21 million currently have PAD, and prevalence could exceed 26 million.
Introduction
Historically, atherosclerotic lower-extremity peripheral arterial disease (PAD) has been underappreciated compared with coronary artery disease and stroke. More recently, there is an increasing recognition that PAD is an important cause of cardiovascular morbidity and mortality, as well as a leading cause of physical disability due to impaired physical function and activity.1,2
It is important to understand the magnitude of the PAD burden in the overall population. This reflects the fact that recognition of PAD is necessary to prescribe evidence-based cardiovascular treatments and lifestyle changes to reduce cardiovascular events and improve physical function.2,3
Those with asymptomatic/atypical disease (AS/AT) should be identified, as well as those who experience the leg symptoms of intermittent claudication (IC) and critical limb ischemia (CLI). This reflects the fact that AS/AT patients have significantly higher mortality and cardiovascular event rates than age-matched controls.4
Patients with AS/AT account for the majority of PAD, and both have an ankle-brachial index (ABI) less than 0.90. However, AS patients do not have exertional limb symptoms, while AT patients have exertional symptoms that are not IC. Both have functional impairment, mobility loss, reduced leg strength, and ischemic changes to nerves and muscle.5
Unfortunately, existing data on PAD estimates have become outdated.2,3 Few estimates of the U.S. prevalence of PAD have been published. The most quoted estimate, 8 million to 12 million, was first published in the PAD Awareness, Risk, and Treatment: New Resources for Survival (PARTNERS) study.6 Although published in the PARTNERS study, the 8 to 12 million number was not based on the results of that study.6 The source of the estimate was the percentage prevalence found in the 1985 Criqui San Diego Study.7 This is designated the Criqui/PARTNERS number.
The Criqui/PARTNERS estimate was calculated using the U.S. population circa 1995.6,7 However, in the past 28 years, the population has aged and diabetes is more prevalent—two key risk factors for PAD.8-17
Because of the above, we believe that the number of U.S. citizens with PAD is likely considerably higher than 8 to 12 million. Others have also noted that more current PAD estimates are needed.2,3 In order to calculate current PAD prevalence more accurately, we developed the Diabetes Method.18
Diabetes Method
The Diabetes Method is a population-based method that calculates the prevalence of PAD by age and glucose status.18-20 The Diabetes Method is as follows: Employing U.S. Census Bureau data for 2010 to 2030, the U.S. population is segmented into 2 age groups: 45 to 64 and those 65 and older.8 Within each of these age groups, the population is divided into the 3 glucose states: diabetes (diagnosed and undiagnosed), prediabetes, and normal. Prediabetes is characterized as impaired fasting glucose or impaired glucose tolerance.11 The percentage in each age group with diabetes, prediabetes, and normal glucose is found in the 2011-2012 National Health and Nutrition Examination Survey (NHANES) data.1
PAD is calculated according to the percentage prevalence in each glucose state. In those 65 and older, we employed the percentage prevalence of PAD in the Cardiovascular Health Study (CHS). In people with diabetes, PAD was present in 31%. In both those with prediabetes and those with normal glucose, PAD prevalence was 11%.21 To the best of our knowledge, no more recent U.S. research has been published that specifies prevalence of PAD by glucose status.
The percentage prevalence of PAD by glucose status in the 45-to-64 age group was estimated based on a review of the published literature.22-30 A detailed discussion and analysis of these can be found in our previous publications.18,19
In people with diabetes, PAD prevalence is between 1.7 to 3.0 times higher than in those with normal glucose.14,15,22-25 Furthermore, the duration of diabetes impacts PAD prevalence, with longer duration associated with increased prevalence.30
Specific percentages employed in the Diabetes Method calculations are PAD present in 27% of those with diabetes, 11% of those with prediabetes, and 10% of those with normal glucose.18-20
Glucose Status by Age Group
Table 1 displays the specific NHANES glucose prevalences by age group that were employed to calculate PAD in 1995 and in the 2010 to 2030 periods. The 2010 to 2030 PAD calculations are based on the glucose prevalences found in the 2011-2012 NHANES data.10 Between 1995 and 2012, the prevalence of diabetes doubled in the 45-to-64 age group, expanding from 8.7% to 17.5%. In older adults, diabetes prevalence almost doubled, from 18.6% to 33.0%, over the 17-year period. Amazingly, by 2012 less than 18% of the older patients had normal glucose.10
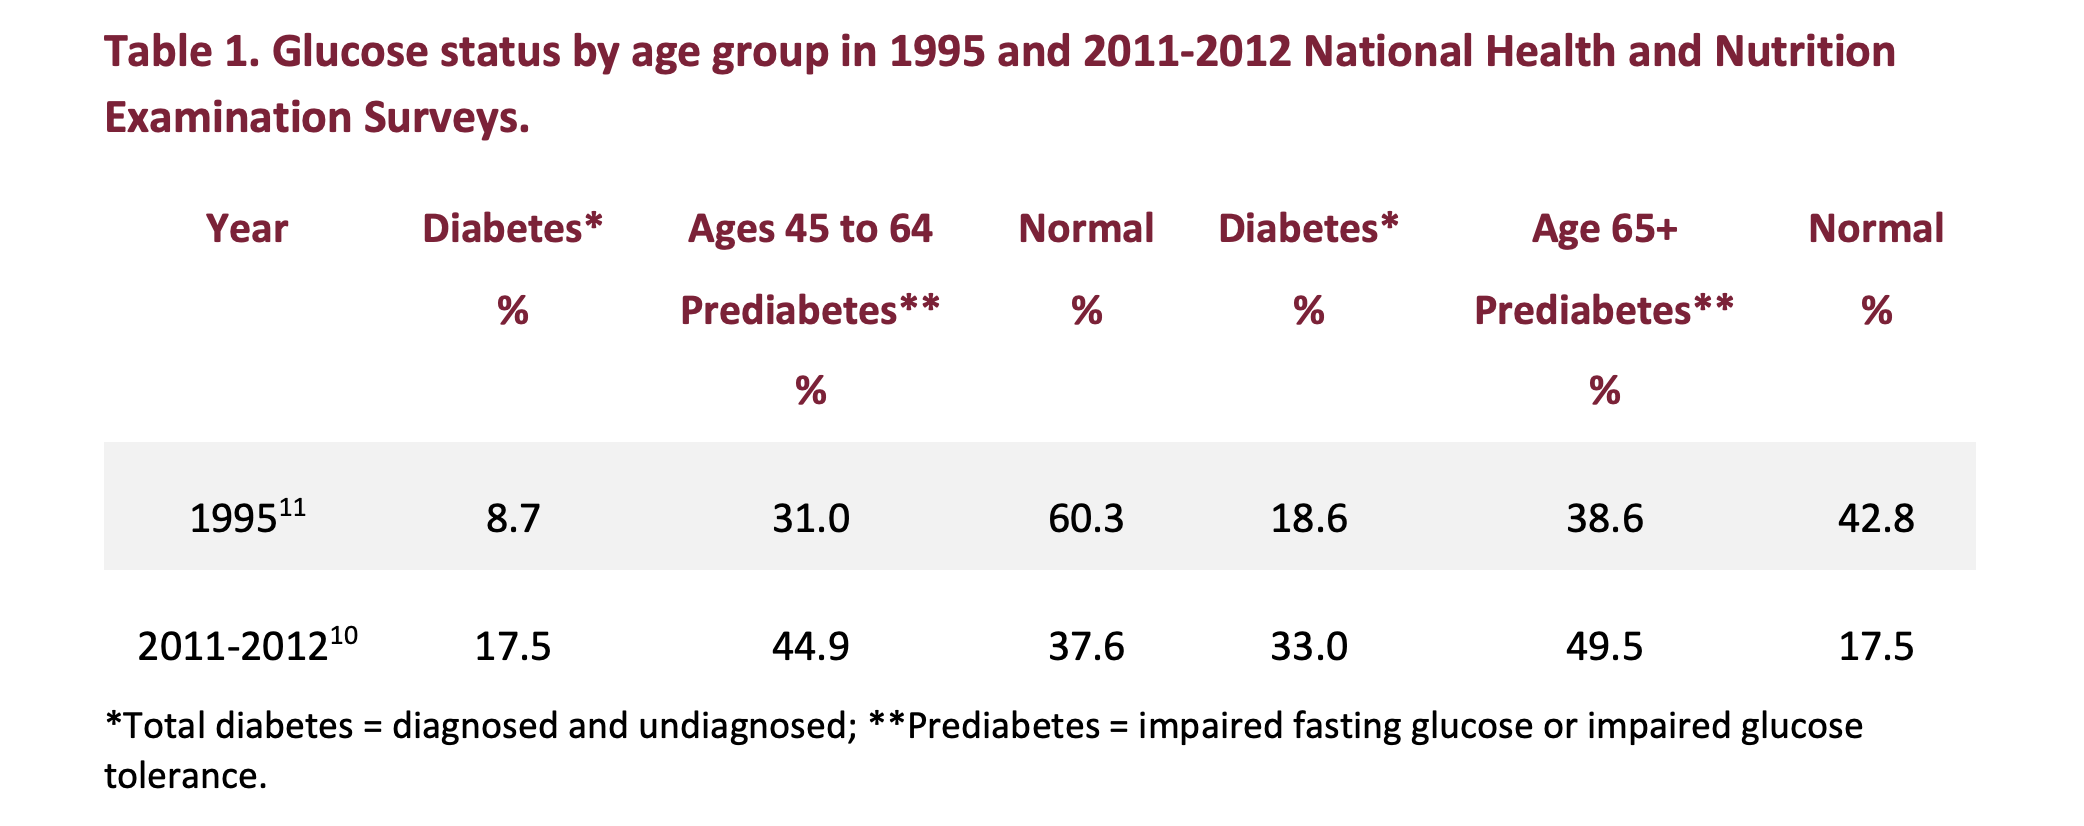
The 1995 glucose prevalences are those reported in the 1988-1994 NHANES.11 These were basis for the 1995 PAD calculations, which were compared with the Nehler and Criqui/PARTNERS estimates.7,31 In those ages 65 and older, glucose categories were as reported.
For the 45-to-64 age groups, the three 1995 glucose categories were estimated based on the prevalence reported in the same NHANES study for those ages 40 to 59 and those 60 and older.11
These estimates are likely conservative. For example, total diabetes was present in 8.8% of those ages 40 to 59 and 19.0% of those 60 and older.11 This compares with the 8.7% and 18.6% we employed for those ages 45 to 64 and 65 and older, respectively.
PAD Prevalence by Age and Glucose Status
The results are shown in Table 2. Between 1995 and 2020, U.S. PAD prevalence increased from 11.3 million to 21.0 million. Based on the aging population, by 2030 the number with PAD is projected at 23.8 million.
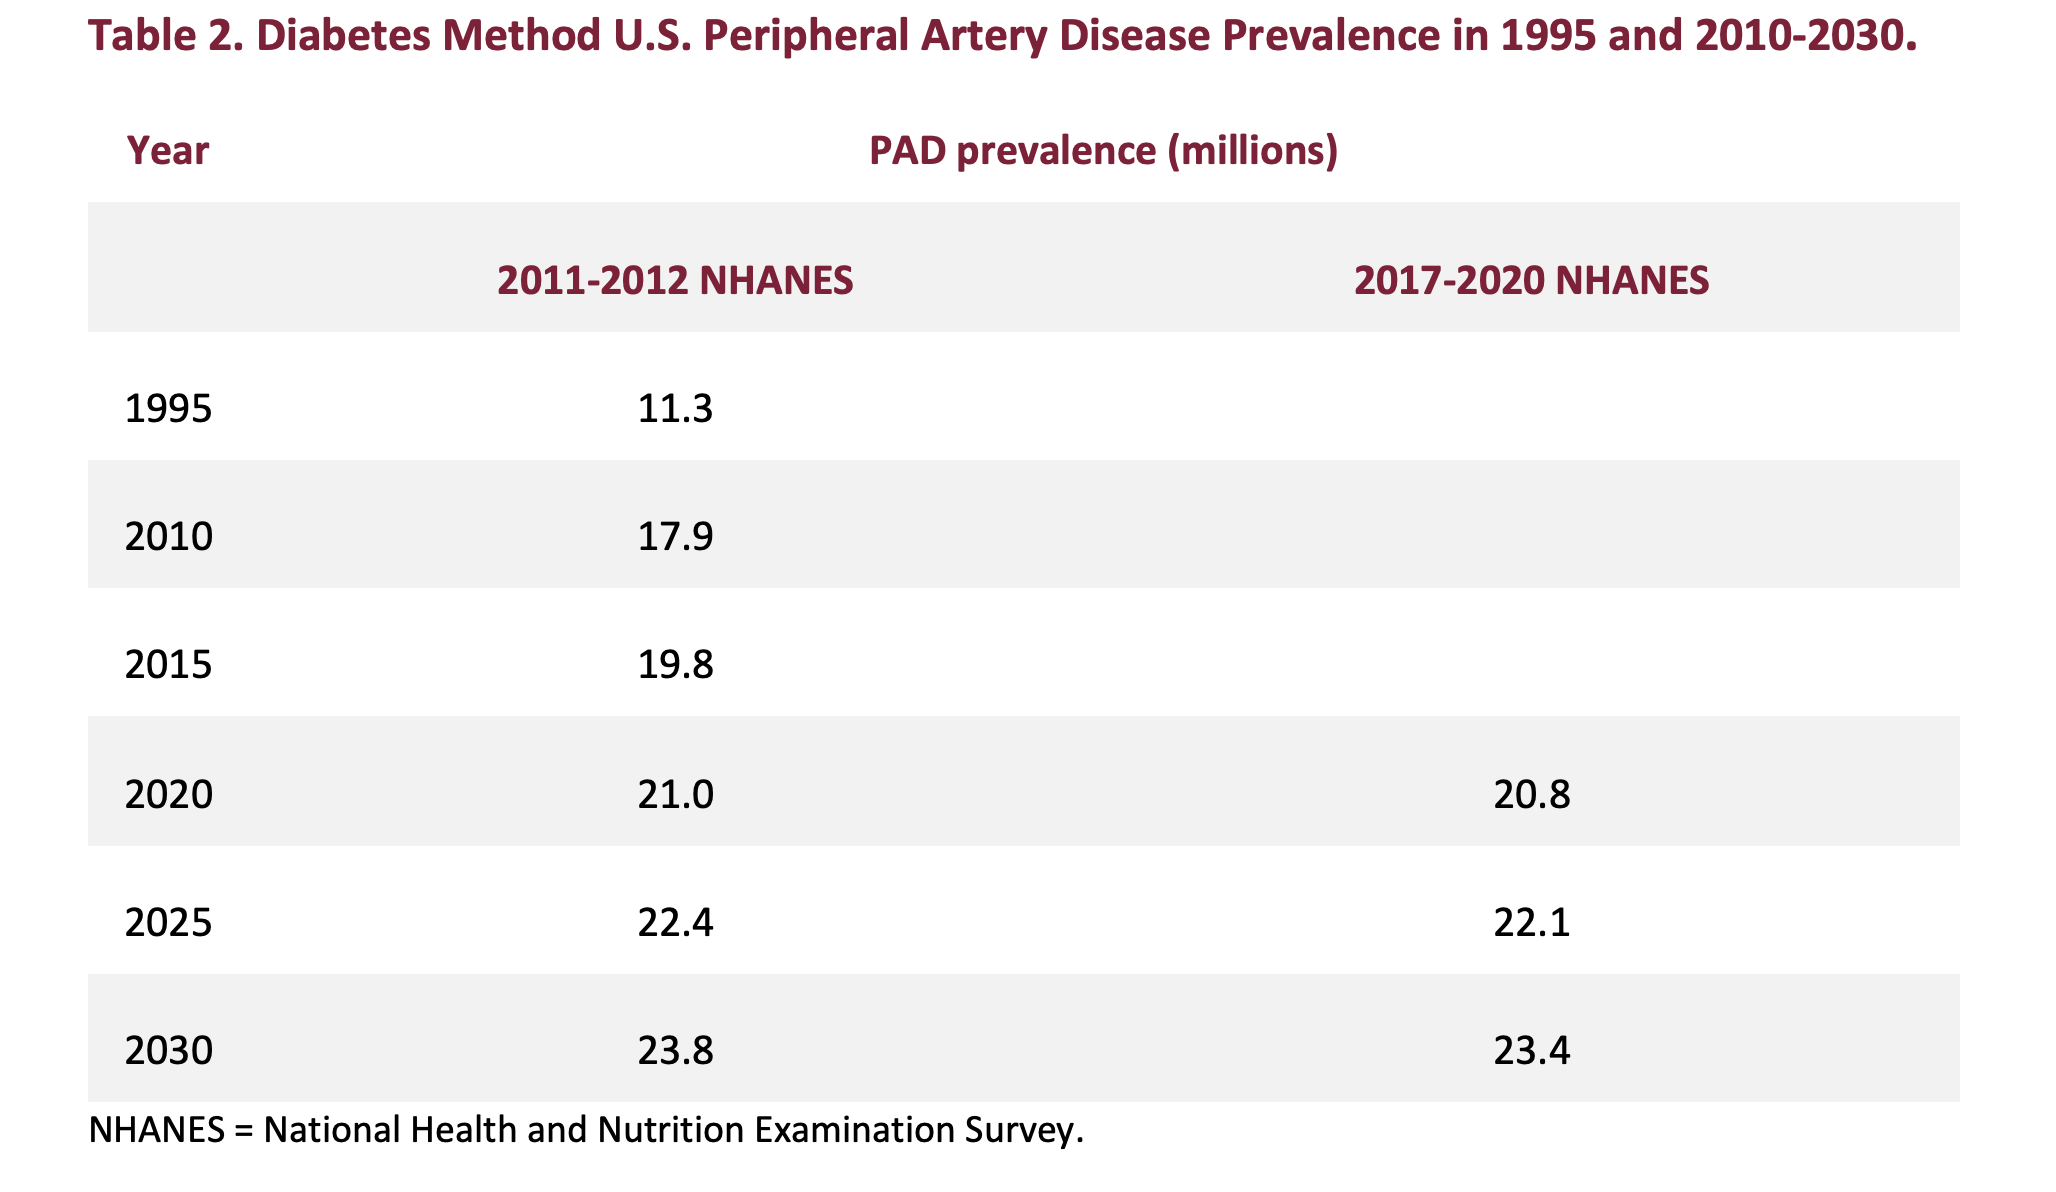 Back testing the 2020 Diabetes Method numbers, 18% of those ages 65 and older have PAD. This includes symptomatic as well as asymptomatic/atypical disease. In addition to the original PAD prevalences calculated using the glucose status found in the 2011-2012 NHANES, Table 2 displays the 2020 to 2030 PAD prevalence calculated using the age-based glucose prevalence found in the more recent 2017-2020 NHANES data.32 In the 2017-2020 NHANES, diabetes and prediabetes were 18.9% and 44.8%, respectively, in the population ages 45 to 64, and 29.2% and 48.8%, respectively, in those ages 65 and older.32
Employing the 2017-2020 NHANES glucose states results in little difference in PAD prevalence for the 2020 to 2030 period, or a variance of approximately 200,000 to 400,000.
In 2 recent publications, PAD prevalence in those ages 65 and older was 13.5% and 27.7%.3,33 Since PAD was defined as claims for inpatient and outpatient diagnosis and treatments, the 13.5% figure undercounts the percentage with PAD.33 This reflects the fact that AS/AT patients, or the majority of those with PAD, were not included.5
In primary care medical practices, 30% to 60% of PAD patients are AS, reporting no exertional leg symptoms. Approximately 45% to 50% have AT disease, reporting exertional leg symptoms that are not consistent with classic intermittent claudication.5
The higher 27.7% prevalence was the result of screening 192,500 U.S. Medicare Advantage beneficiaries aged 65 and older in the Optum HouseCalls program between April 1, 2017, and February 1, 2019. Notably, screening was performed with a plethysmography system (QuantaFlo-Semler Scientific). Using contrast angiography as the reference, a plethysmography index value of 0.99 or less has a sensitivity of 86.0%, a specificity of 100%, and an accuracy of 87.5% to detect PAD.3
Applying the 27.7% percentage to the 2020 population ages 65 and older results in 15.2 million older adults with PAD. Adding this to the Diabetes Method prevalence in those ages 45 to 65 yields a total of 26.4 million with PAD, which is 5.4 million higher than the Diabetes Method estimate.
Comparison of Diabetes Method, Criqui/PARTNERS, and Nehler PAD
Prevalence
Since the 8 to 12 million Criqui/PARTNERS number remains the most quoted, we compared it with the numbers derived by the Diabetes Method as well as the population-based numbers calculated employing the Nehler percent prevalence in the population ages 40 and older.6,7,31
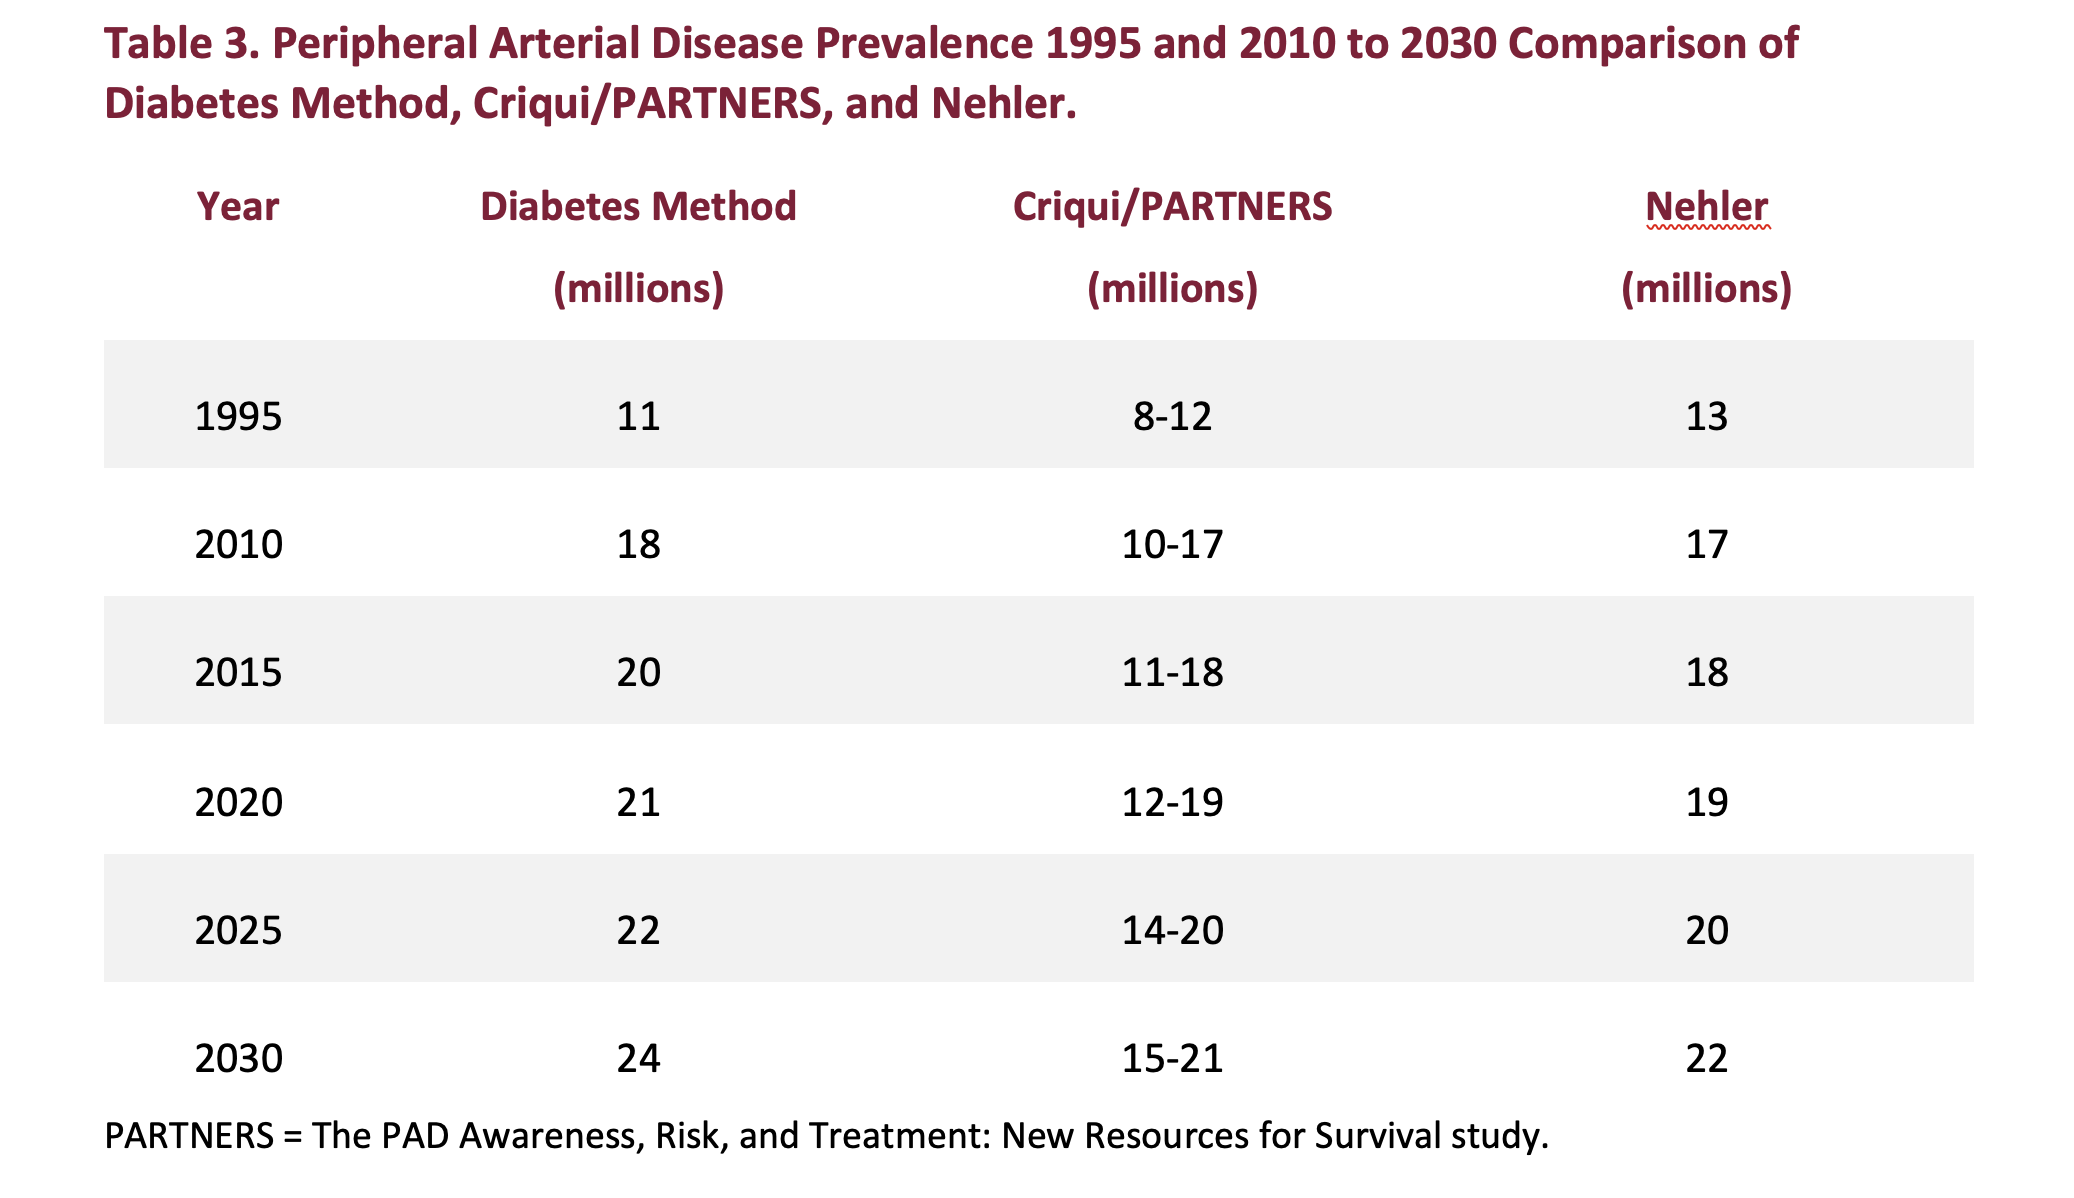
Table 3 displays PAD prevalence for 1995 and the 2010 to 2030 periods calculated by 3 methods: Diabetes Method, Criqui/PARTNERS, and Nehler Method. The Diabetes Method estimates are based on the population ages 45 and older, while the Criqui/PARTNERS and Nehler Method numbers are based on the population ages 40 and older.7,31
 Criqui/PARTNERS Study
Although the 8 to 12 million PAD estimate was published in the PARTNERS study, it was not based on the results of that study.6 The source of the estimate was the percentage prevalence found in the 1985 Criqui San Diego Study.7
The San Diego study was conducted in 613 white, upper-middle class subjects ages 38 to 82 residing in Southern California. PAD was defined as an ABI less than 0.80; the definition also included a series of 4 noninvasive tests.7 The study concluded that 11.7% of those ages 40 and older had PAD. By age group, the percentage prevalences were: 2.5% in those 40 to 59, 8.3% in those 60 to 69, and 18.8% in those 70 and older.7
These percent prevalence estimates are likely to be low, which reflects several factors. Employing an ABI less than 0.80 is a more restrictive definition than an ABI less than 0.90, which is normally the ABI cut-point employed in PAD epidemiological studies.13-16,21 Because PAD is significantly more prevalent in African Americans, prevalence based on Whites only will understate the number of U.S. citizens with PAD.34
No specific population-based estimate of PAD prevalence was published in the 1985 study, or in any of the subsequent studies by Criqui and colleagues. It appears that the calculation was made at some later date for inclusion into the discussion section of the PARTNERS study. The calculations appear to be based on the U.S. population circa 1995. Email correspondence with Criqui and Hiatt on April 8, 2011, was unable to specify a date for the estimate or a year on which it was based.
Notably, the 1995 Diabetes Method estimate of 11 million falls in the middle of the 8 to 12 million range. The Diabetes Method numbers for 2010 and 2015 are in line with the high end of the Criqui/PARTNERS range for those years. This reflects a combination of the increasing prevalence of diabetes from 1995 to 2012 and the aging of the U.S. population.8-11
In the 2020 to 2030 period, the divergence widens due to the aging of the U.S. population. In 1995, 13% of the total population was 65 and older. By 2015, the percentage increased to 15%, and by 2030 is expected to rise to 21%.35,36
Nehler Study
The 2014 study by Nehler and colleagues examined the epidemiology of PAD and CLI in a large insured national population. This was a retrospective cohort analysis of adults with commercial, Medicare supplemental, or Medicaid health insurance with 12 months of continuous coverage who had at least 1 health care claim for PAD or CLI from January 1, 2003, through December 31, 2008. In the population ages 40 and older, average total PAD prevalence was 12.02%.31
Applying the 12.02% prevalence to the 1995 population ages 40 and older results in 13 million with PAD. For the years 2010 to 2030, the Nehler PAD estimates are at the high end of the range calculated by the Criqui/PARTNERS prevalences.
The PAD estimates based on the Nehler study are somewhat lower than those calculated by the Diabetes Method. One factor is that the Diabetes Method numbers represent all patients, whether diagnosed and treated. In contrast, the Nehler numbers represent insured patients who are diagnosed and treated.31
The growing difference between the Diabetes Method and Nehler numbers in the 2015 to 2030 period reflects 2 factors: the impact of the aging population and the impact of glucose status. The number of those who have the highest prevalence of PAD—the population ages 65 and older—is expected to increase from 31% of those ages 40 and older in 2015 to 41% by 2030.3,8,21,36
The Nehler calculation is based on the entire population ages 40 and older and does not distinguish between differences in age-related prevalence. Furthermore, the Nehler calculations do not account for the higher prevalence of PAD in those who have diabetes, which is especially significant in older adults. For example, the CHS found that 31% of those with diabetes who were ages 65 and older had PAD vs 11% of those with normal glucose.21 By gender, PAD prevalence in the elderly was 29% in males and 33% in females.
Conclusions
According to the Diabetes Method, 21 million U.S. citizens ages 45 and older had PAD in 2020, up substantially from 11.3 million in 1995. Modifying the Diabetes Method calculations to include the higher prevalence found in recent Medicare data results in an even greater number of those with PAD in 2020, or 26 million.
In 1995, the Diabetes Method’s 11.3 million prevalence agrees with the most frequently quoted PAD estimate, 8 to 12 million, which was calculated based on the U.S. population circa 1995. Current PAD prevalence appears to be significantly higher than commonly stated. n
Mary Yost, MBA, is president and cofounder of The Sage Group. The Sage Group is a for-profit research and consulting company, specializing in peripheral artery disease and chronic and acute venous disease.The following companies have been clients in the last 2 years:
Purchased Research: ACV Centers, Bain & Company, Becton Dickinson, Boston Scientific, Cardiovascular Solutions of Central Mississippi, Gore, ICHOR, Shockwave Medical, Veryan Medical, Surmodics
Consulting Clients: Becton Dickinson, Biotronik, Boston Scientific, Cardiovascular Solutions of Central Mississippi, Cordis, Zelira Therapeutics, Vesper Medical, Votis Subdermal Imaging Ltd., One MedTech, Janssen Pharmaceuticals
Manuscript accepted March 27, 2023
Address for correspondence: Mary L. Yost, MBA, The Sage Group LLC, Beaufort, South Carolina. Email: yost@thesagegroup.us
REFERENCES
1. Aday AW, Matsushita K. Epidemiology of peripheral artery disease and polyvascular disease. Circ Res. 2021;128(12):1818-1832. doi:10.1161/CIRCRESAHA.121.318535
2. Criqui MH, Matsushita K, Aboyans V, et al. Lower extremity peripheral artery disease: contemporary epidemiology, management gaps, and future directions: a scientific statement from the American Heart Association. Circulation. 2021;144(9):e171-e191. doi:10.1161/CIR.0000000000001005
3. Smolderen KG, Ameli O, Chaisson CE, Heath K, Mena-Hurtado C. Peripheral artery disease screening in the community and 1-year mortality, cardiovascular events, and adverse limb events. AJPM Focus. 2022;1(1):100016. doi:10.1016/jfocus.2022.100016
4. Sartipy F, Garcia Pereira Filho AJ, Lundin F, Wahlberg E, Sigvant B. Presence of asymptomatic peripheral arterial disease in combination with common risk factors elevates the cardiovascular risk substantially. Int J Cardiol Cardiovasc Risk Prev. 2022;13:200130. doi:10.1016/j.ijcrp.2022.200130
5. McDermott MM. Lower extremity manifestations of peripheral artery disease: the pathophysiologic and functional implications of leg ischemia. Circ Res. 2015;116(9):1540-1550. doi:10.1161/CIRCRESAHA.114.303517
6. Hirsch AT, Criqui MH, Treat-Jacobson D, et al. Peripheral arterial disease detection, awareness, and treatment in primary care. JAMA. 2001;286(11):1317-1324. doi:10.1001/jama.286.11.1317
7. Criqui MH, Fronek A, Barrett-Connor E, Klauber MR, Gabriel S, Goodman D. The prevalence of peripheral arterial disease in a defined population. Circulation. 1985;71(3):510-515. doi:10.1161/01.cir.71.3.510
8. United States Census Bureau. 2008 National Population Projections Tables. Table 12: Projections of the population by age and sex for the United States: 2010 to 2050 (NP2008-T12). https://www.census.gov/data/tables/2008/demo/popproj/2008-summary-tables.html
9. United States Census Bureau. Current Population Reports, P25-1095; "Table US-EST90INT-04 Intercensal Estimates of the United States Resident Population by Age Groups and Sex, 1990- 2000: Selected Months," September 2002; and "Annual Estimates of the Resident Population by Sex and Five-Year Age Groups for the United States: April 1, 2000, to July 1, 2009 (NCEST2009-01)." https://www.census.gov/data/tables.html
10. Menke A, Casagrande S, Geiss L, Cowie CC. Prevalence of and trends in diabetes among adults in the United States, 1988-2012. JAMA. 2015;314(10):1021-1029. doi:10.1001/jama.2015.10029
11. Cowie CC, Rust KF, Byrd-Holt DD, et al. Prevalence of diabetes and impaired fasting glucose in adults in the U.S. population: National Health and Nutrition Examination Survey 1999-2002. Diabetes Care. 2006;29(6):1263-1268. doi:10.2337/dc06-0062
12. Criqui MH, Vargas V, Denenberg JO, et al. Ethnicity and peripheral arterial disease: the San Diego Population Study. Circulation. 2005;112(17):2703-2707. doi:10.1161/CIRCULATIONAHA.105.546507
13. Savji N, Rockman CB, Skolnick AH, et al. Association between advanced age and vascular disease in different arterial territories: a population database of over 3.6 million subjects. J Am Coll Cardiol. 2013;61(16):1736-1743. doi:10.1016/j.jacc.2013.01.054
14. Eraso LH, Fukaya E, Mohler ER 3rd, Xie D, Sha D, Berger JS. Peripheral arterial disease, prevalence and cumulative risk factor profile analysis. Eur J Prev Cardiol. 2014;21(6):704-711. doi:10.1177/2047487312452968
15. Selvin E, Erlinger TP. Prevalence of and risk factors for peripheral arterial disease in the United States: results from the National Health and Nutrition Examination Survey, 1999-2000. Circulation. 2004;110(6):738-743. doi:10.1161/01.CIR.0000137913.26087.F0
16. Shah B, Rockman CB, Guo Y, et al. Diabetes and vascular disease in different arterial territories. Diabetes Care. 2014;37(6):1636-1642. doi:10.2337/dc13-2432
17. Centers for Disease Control and Prevention. National and state diabetes trends. Diabetes incidence and prevalence. Figure 2. Accessed March 1, 2023. https://www.cdc.gov/diabetes/library/reports/reportcard/national-state-diabetes-trends.html
18. Yost ML. Critical Limb Ischemia Volume I. United States Epidemiology. The Sage Group; 2007.
19. Yost ML. Critical Limb Ischemia Volume I. United States Epidemiology. The Sage Group; 2010.
20. Yost ML. Critical Limb Ischemia. Volume I. United States Epidemiology. 2016 supplement. The Sage Group; 2016.
21. Barzilay JI, Spiekerman CF, Kuller LH, et al. Prevalence of clinical and isolated subclinical cardiovascular disease in older adults with glucose disorders: the Cardiovascular Health Study. Diabetes Care. 2001;24(7):1233-1239. doi:10.2337/diacare.24.7.1233
22. Walters DP, Gatling W, Mullee MA, Hill RD. The prevalence, detection, and epidemiological correlates of peripheral vascular disease: a comparison of diabetic and non-diabetic subjects in an English community. Diabet Med. 1992;9(8):710-715. doi:10.1111/j.1464-5491.1992.tb018
23. Mackaay AJ, Beks PJ, Dur AH, et al The distribution of peripheral vascular disease in a Dutch Caucasian population: comparison of type II diabetic and non-diabetic subjects. Eur J Vasc Endovasc Surg. 1995;9(2):170-175. doi:10.1016/s1078-5884(05)80086-3
24. Beach KW, Strandness DE Jr. Arteriosclerosis obliterans and associated risk factors in insulin-dependent and non-insulin-dependent diabetes. Diabetes. 1980;29(11):882-888. doi:10.2337/diab.29.11.882
25. Brandle M, Zhou H, Smith BRK, et al. The direct medical cost of type 2 diabetes. Diabetes Care. 2003;26(8):2300-2304. doi:10.2337/diacare.26.8.2300
26. Palumbo PJ, Melton LJ. Peripheral vascular disease and diabetes. In: Diabetes in America. 2nd ed. National Diabetes Data Group of the National Institute of Diabetes and Digestive and Kidney Diseases; 1995. NIH Publication No. 95-1468. p. 401-408.
27. Kallio M, Forsblom C, Groop PH, Groop L, Lepäntalo M. Development of new peripheral arterial occlusive disease in patients with type 2 diabetes during a mean follow-up of 11 years. Diabetes Care. 2003;26(4):1241-1245. doi:10.2337/diacare.26.4.1241
28. Faglia E, Caravaggi C, Marchetti R, et al. Screening for peripheral arterial disease by means of the ankle-brachial index in newly diagnosed Type 2 diabetic patients. Diabet Med. 2005;22(10):1310-1314. doi:10.1111/j.1464-5491.2005.01612.x
29. Norman PE, Davis WA, Bruce DG, Davis TME. Peripheral arterial disease and the risk of cardiac death in type 2 diabetes: the Fremantle Diabetes Study. Diabetes Care. 2006;29(3):575-580. doi:10.2337/diacare.29.03.06.dc05-1567
30. Beks PJ, Mackaay AJ, de Neeling JN, de Vries H, Bouter LM, Heine RJ. Peripheral arterial disease in relation to glycaemic level in an elderly Caucasian population: the Hoorn study. Diabetologia. 1995;38(1):86-96. doi:10.1007/BF02369357
31. Nehler MR, Duval S, Diao L, et al. Epidemiology of peripheral arterial disease and critical limb ischemia in an insured national population. J Vasc Surg. 2014;60(3):686-695.e2. doi:10.1016/j.jvs.2014.03.290
32. Centers for Disease Control and Prevention. National Diabetes Statistics Report. Accessed March 1, 2023. https://www.cdc.gov/diabetes/data/statistics-report/index.html
33. Kalbaugh CA, Kucharska-Newton A, Wruck L, et al. Peripheral artery disease prevalence and incidence estimated from both outpatient and inpatient settings among Medicare fee-for- service beneficiaries in the Atherosclerosis Risk in Communities (ARIC) Study. J Am Heart Assoc. 2017; 6(5):e003796. doi:10.1161/JAHA.116.003796
34. Allison MA, Ho E, Denenberg JO, et al. Ethnic-specific prevalence of peripheral arterial disease in the United States. Am J Prev Med. 2007;32(4):328-333. doi:10.1016/j.amepre.2006.12.010
35. United States Census Bureau. Facts for Features: Older Americans Month: May 2017. Press Release Number CB17-FF.08 April 10, 2017. Accessed March 1, 2023. https://www.census.gov/newsroom/facts-for-features/2017/cb17-ff08.html
36. United States Census Bureau. Projected Age Groups and Sex Composition of the Population: Main Projections Series for the United States, 2017-2060. United States Census Bureau, Population Division; 2018.
