

Costs of Care for Patients Receiving Chemotherapy for Advanced Bladder Cancer
Affiliations:
1 Department of Urology, Division of Surgery, The University of Texas MD Anderson Cancer Center, Houston, TX;
2 Merck & Co., Inc., Kenilworth, NJ;
3 Department of Genitourinary Medical Oncology, The University of Texas MD Anderson Cancer Center, Houston, TX.
Address correspondence to:
Dr Kyle Flannery Merck & Co. 351 N Sumneytown Pike North Wales, PA Phone: (267) 305-3392 Email: kyle.flannery@merck.com
Abstract:
There is limited information on chemotherapy treatment patterns, health care visits, costs, and survival among patients with advanced bladder cancer. This was a retrospective cohort study of patients using the SEER-Medicare data set. First-line (1L) and second-line (2L) chemotherapy treatment patterns; health care visits; costs of health care in 2016 US dollars; and survival patterns were calculated from the index therapy date. Of 1215 patients diagnosed with advanced bladder cancer, 411 (33.8%) received 1L chemotherapy and 189 (15.6%) subsequently received 2L chemotherapy. During the 1L and 2L treatment windows, totals of 28.5 and 22.7 visits per patient were recorded, respectively. The total costs of cancer care during the 1L and 2L treatment windows were $36,790 and $26,730, respectively, of which more than $10,000 in costs were paid directly by the patient. Systemic therapy for bladder cancer is costly and should be weighed against the clinical outcomes likely to be achieved. Neither 1L nor 2L patients in this study experienced a median survival beyond 1 year following treatment initiation.
Disclosures: Drs Cao, He, Zhong, and Flannery are employees of Merck & Co, Inc. Drs Kamat and Shah have no relevant financial relationships to disclose.
Acknowledgements: The authors wish to thank Anna Kaufman, MPH, in collaboration with ScribCo, for medical writing assistance.
Funding: This work was financially supported by Merck & Co, Inc.
Key words: Chemotherapy, health care costs, health economics outcomes research, urinary bladder cancer.
Citation: Journal of Clinical Pathways. 2017:3(10):63-70. Received November 13, 2017; accepted November 27, 2017
The most common types of cancer in the United States are breast, lung and bronchus, prostate, and colon and rectum, with incidences in the range of 40 to 67 cases per 100,000 individuals, and urinary bladder cancer, with an incidence of 20 cases per 100,000 individuals, based on data for the period between 2010 and 2014.1
Bladder cancer incidence is much higher in individuals aged 65 years or older than in those aged younger than 65 years (122 vs 5.1 per 100,000).1 The cost burden of bladder cancer in the United States largely falls on individuals receiving Medicare.
Between 2007 and 2013, distant cancers that had spread from the original tumor accounted for 4% of all bladder cancer diagnoses.1 Cisplatin-based combination chemotherapy is the standard of care for first-line (1L) systemic therapy.2 Treatment of advanced bladder cancer is largely palliative, and its costs should be weighed against the limited survival benefits: The 5-year survival rate of advanced bladder cancer is 5%.3
There are few published studies of the health care costs and outcomes of chemotherapy treatment of advanced bladder cancer. Our objective was to report treatment patterns; the source, setting, and division of costs; and survival outcomes for patients receiving systemic chemotherapy for advanced bladder cancer. The results of this study will also represent a baseline against which to assess the costs and outcomes of new immunotherapies likely to emerge in the coming years.
METHODS
Study Design
This was a retrospective cohort study of patients identified in the SEER-Medicare database. The SEER-Medicare linked database contains clinical information on incident cancer cases in the United States between 1991 and 2011 from the SEER cancer registry, and longitudinal administrative Medicare claims from 1991 to 2013 for Medicare Parts A and B enrollees. Patients with a new diagnosis of advanced bladder cancer during the patient identification period—from January 1, 2007 through December 31, 2011—who received 1L or second-line (2L) chemotherapy were followed for a minimum of 24 months. Treatment regimens, health care visits, costs, and survival after beginning 1L and 2L chemotherapy were determined. The index diagnosis date was defined as the date of the advanced diagnosis. The baseline period consisted of the 6 months prior to the index diagnosis date. Patient demographic characteristics were documented in the baseline period.
The index therapy date was defined as the date of chemotherapy (1L or 2L) initiation. The treatment exposure window was defined as the time from the first dose of chemotherapy through the end of the last cycle in that line of therapy. Patients included in the study were followed until the earliest date of death, health maintenance organization (HMO) enrollment, last known date of follow-up in the SEER-Medicare database, or the end of the study period (December 31, 2013). There was no minimum or maximum follow-up required for the analysis.
Study Sample
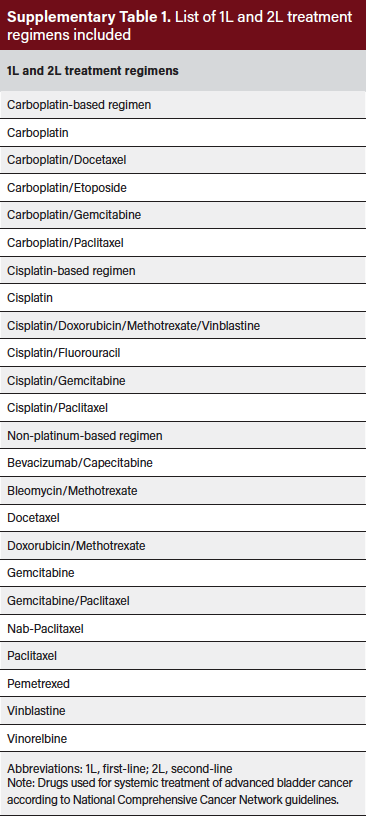
The study sample consisted of patients aged 65 years and older with a new primary diagnosis of stage IV bladder cancer with TNM staging as either T4b, N0, M0; any T, N1–N3, M0; or any T, any N, M1. Patients were required to have continuous enrollment in Medicare Part A and Part B with no HMO enrollment during the study period. Patients were excluded if they had concomitant or prior history of malignancy other than bladder cancer. Patients who received chemotherapy were identified using Healthcare Common Procedures Coding System or National Drug Code code numbers for specific agents categorized as carboplatin-based regimens, cisplatin-based regimens, and nonplatinum-based regimens. A full list of chemotherapy regimens for patients in the study sample is provided in the Online Supplemental Material (Supplementary Table 1).
Outcome Measures
The outcomes of interest were chemotherapy treatment patterns, health care visits, costs, and survival. Chemotherapy regimens (1L and 2L) were described according to agent, time of initiation after diagnosis, and duration of treatment.
Adverse events (AEs) of interest were those occurring during the 1L and 2L chemotherapy treatment exposure windows, with a severity grade of 3/4, and with an incidence of greater than or equal to 5% as reported in the United States prescribing information for drugs used in 1L and 2L treatment of bladder cancer. AEs of interest that required resource use, and were not only lab investigations (based on the Common Terminology Criteria for Adverse Events description and clinical input), were chosen for inclusion in this study.
Health care visits and costs occurring during the 1L and 2L treatment exposure windows were determined. Health care visits and costs occurring outside of the treatment exposure windows were not included in this analysis. Health care visits and costs were categorized as bladder cancerrelated, AE-related, or other. Bladder cancer–related visits and costs were those with an International Classification of Diseases, Ninth Revision (ICD-9) code indicating bladder cancer (codes 188.x, 189.1-189.3, 233.7, 236.7, and 239.4) as the primary diagnosis. AE–related visits and costs were those with a primary claim for a listed AE. Other visits and costs were those that were neither bladder cancer– nor AE– related. Health care costs were also categorized by payer according to data extracted from the Medicare claims data. The claims data divides payments into three categories: Medicare payments, primary payer payments (referred to as “other payer” in this study), and patient copay/deductible payments (referred to as “patient payment” in this study). The primary payer or “other payer” represents any other insurance company that the patient receives health care insurance from.
Covariates
Patient demographic characteristics were documented in the baseline period. Patient age and cancer disease status (described by TNM stage) were determined as of the index diagnosis date. Comorbidities were identified by ICD-9 diagnostic codes recorded during the baseline period and summarized with the adjusted Charlson Comorbidity Index (CCI) score, with the CCI score adjusted for cancer.
Data Analysis
All analyses were stratified by line of chemotherapy treatment (1L and 2L). A descriptive analysis was conducted, and no statistical comparisons of outcomes for different chemotherapy regimens were undertaken. Patient demographic and clinical characteristics at baseline were described. Where applicable, data has been coarsened in order to conform with the Centers for Medicare & Medicaid Services (CMS) Cell Size Suppression Policy, which sets the minimum threshold for the display of CMS data. The policy specifies that no cell containing a value of 1 to 10 patients can be reported directly, and no cell can be reported that allows a value of 1 to 10 to be derived from other reported cells or information. Health care visits and costs during the 1L and 2L treatment exposure windows were reported as averages as well as per-patient-per-month (PPPM) values, to account for variable durations of treatment. PPPM values were calculated as the total value, divided by the patient-specific days in the treatment exposure window, multiplied by 30. Health care visits and costs were classified by setting of care: outpatient, emergency, inpatient, skilled nursing facility, and hospice. Health care costs were further categorized based upon the total amount of money paid as well as the amount of the claim paid by Medicare, patient, and other payer. Costs are reported in 2016 US dollars (USD). Survival from the index therapy date was expressed as a median and as a survival rate (percent survival) at 1, 2, and 3 years. In addition, the KaplanMeier method was utilized to evaluate time-to-event outcomes from the index therapy date.
RESULTS
Patients Of 1215 patients identified with an advanced diagnosis, 804 (66.2%) were not treated with chemotherapy. The remaining 411 (33.8%) received 1L chemotherapy, and 189 (15.6%) subsequently received 2L chemotherapy.
Patient Characteristics
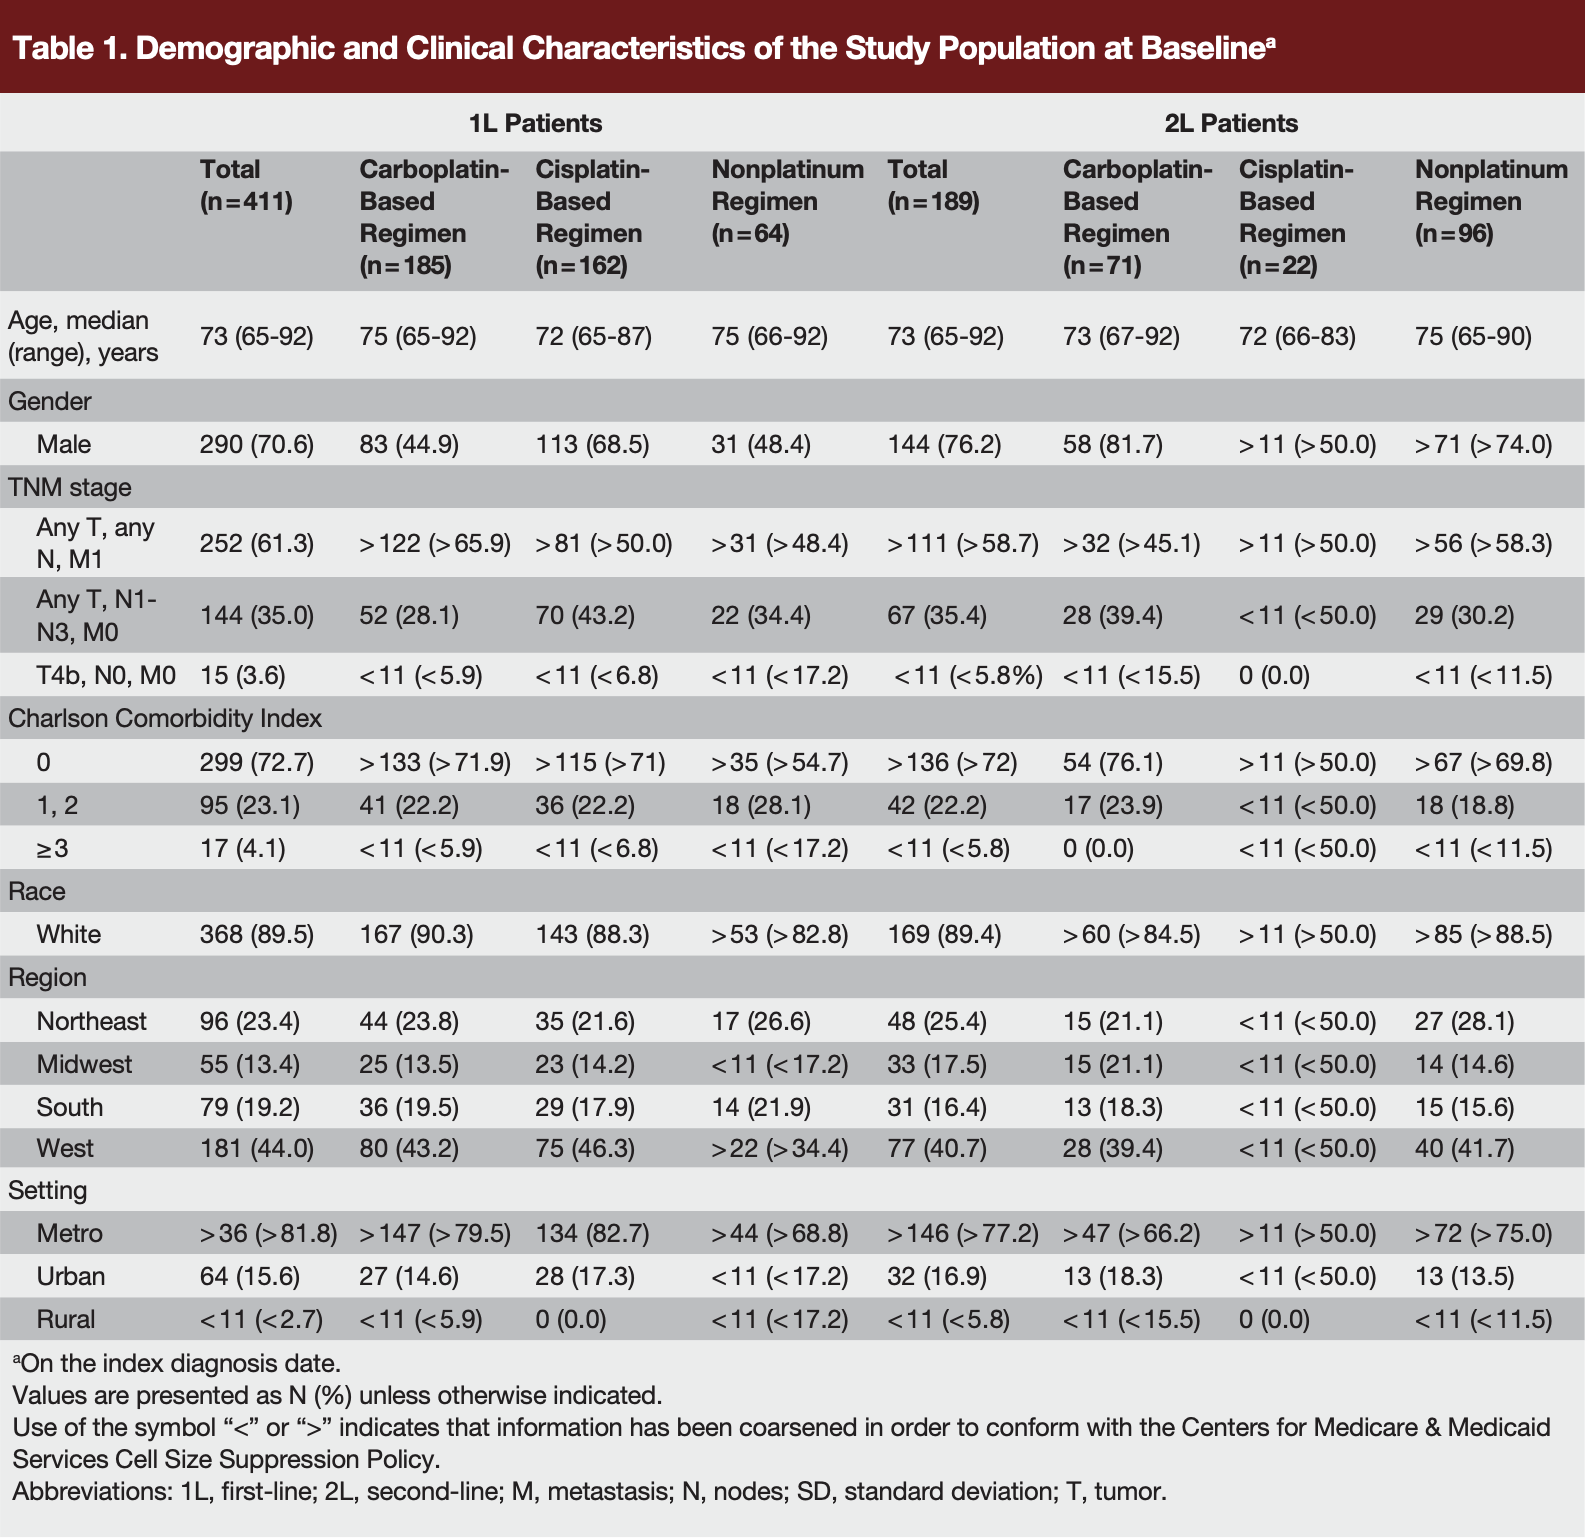
Characteristics of patients receiving 1L and 2L treatment are shown in Table 1. The median age at diagnosis was 73 years. Most patients in the 1L group were male (70.6%) and white (89.5%), and approximately three-fourths (72.7%) had a baseline adjusted CCI score of 0. Fewer than 5% of patients had a baseline adjusted CCI score > 2. Demographic and clinical characteristics of patients who received 2L treatment were similar to those in the 1L group (Table 1).
Treatment Patterns
First-line treatment were carboplatin-, cisplatin-, and non– platinum-based regimens in 45.0%, 39.4%, and 15.6% of patients, respectively (Table 1). The mean time from diagnosis to first dose of 1L chemotherapy was 17.3, 16.9, and 30.4 weeks for cisplatin-, carboplatin-, and nonplatinumbased therapy, respectively (data not shown). Second-line treatments were nonplatinum-, carboplatin-, and cisplatin-based regimens in 50.8%, 37.6%, and 11.6% of patients (Table 1). The mean time from initial advanced bladder cancer diagnosis to first dose of 2L chemotherapy was 55.2, 46.8, and 50.4 weeks for carboplatin-, cisplatin-, and nonplatinum-based therapy (data not shown).
Treatment Duration
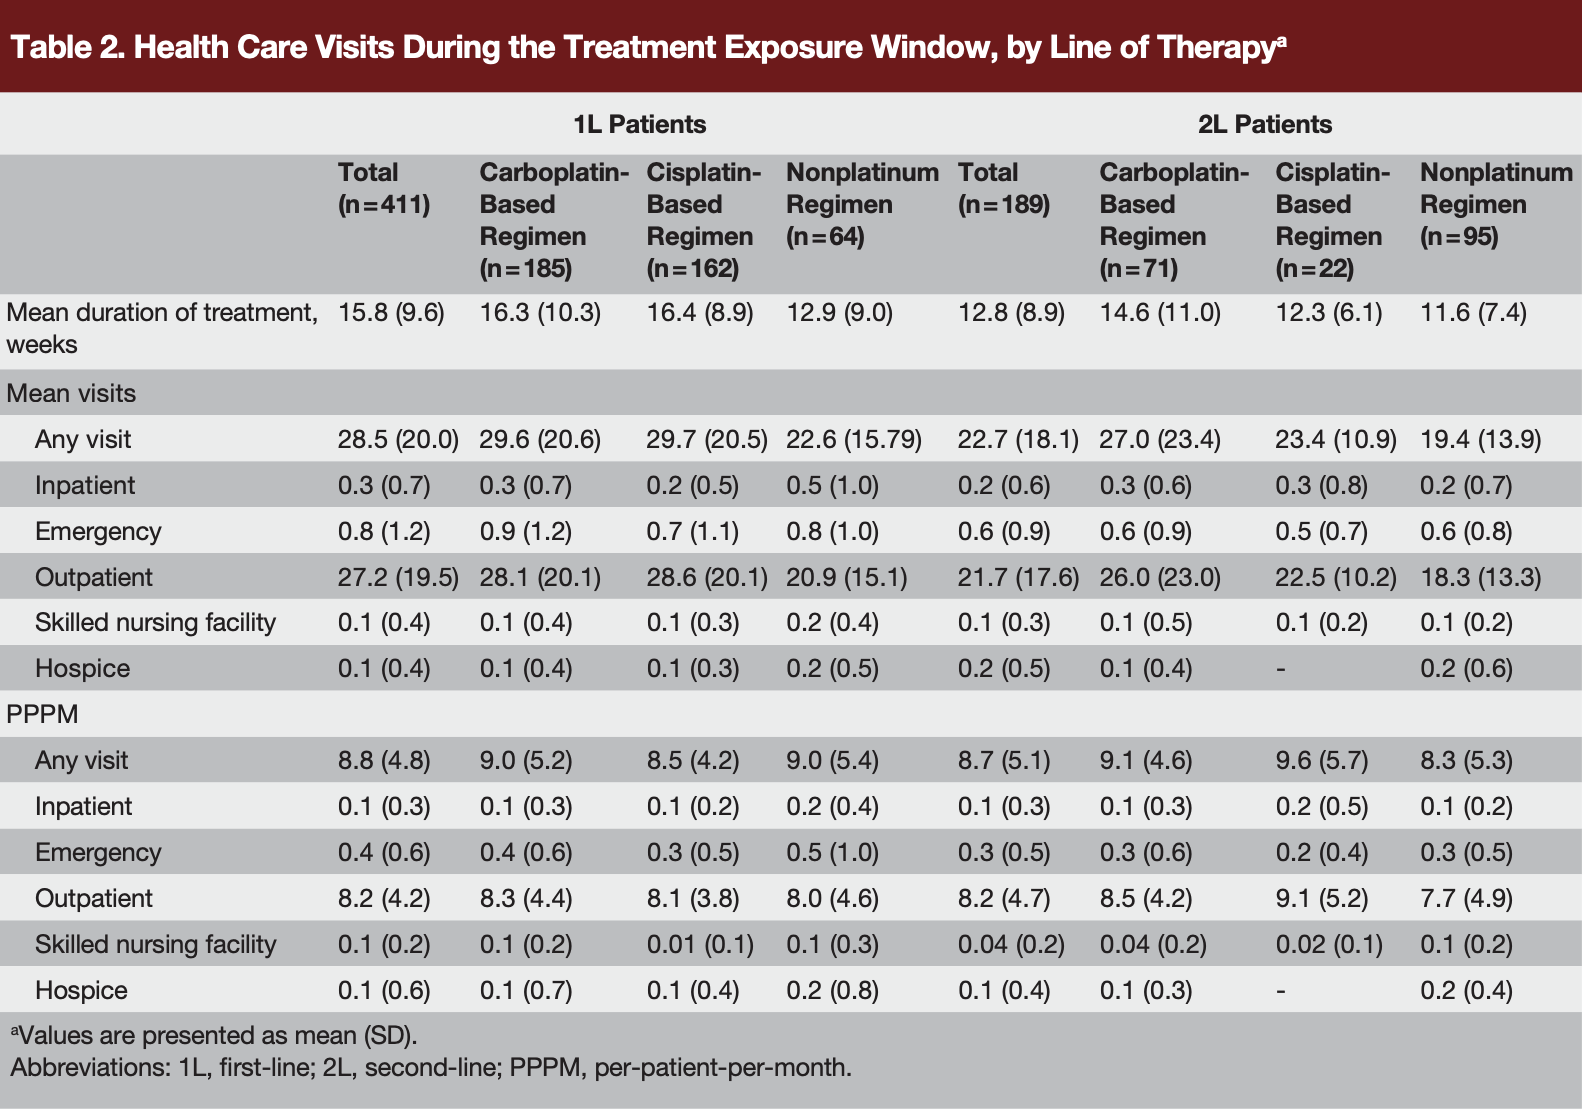
The mean durations of the 1L and 2L treatment exposure windows were 15.8 and 12.8 weeks, respectively (Table 2). The mean number of visits per patient during the 1L and 2L treatment exposure windows was 28.5 and 22.7, respectively, corresponding to 8.8 and 8.7 visits PPPM. Most visits during both 1L and 2L treatment were in the outpatient setting: 27.2 and 21.7 visits per patient, respectively (Table 2). Bladder cancer–related visits accounted for the most 1L health care visits (17.6 visits), followed by otherrelated (9.2), and AE–related visits (5.6; Supplementary Table 2). The same trend was seen with 2L health care visits; mean per patient visits were 14.9 for bladder cancer–related visits, followed by other-related visits (7.7) and AE–related visits (3.7; Supplementary Table 2).
Cancer Care Costs
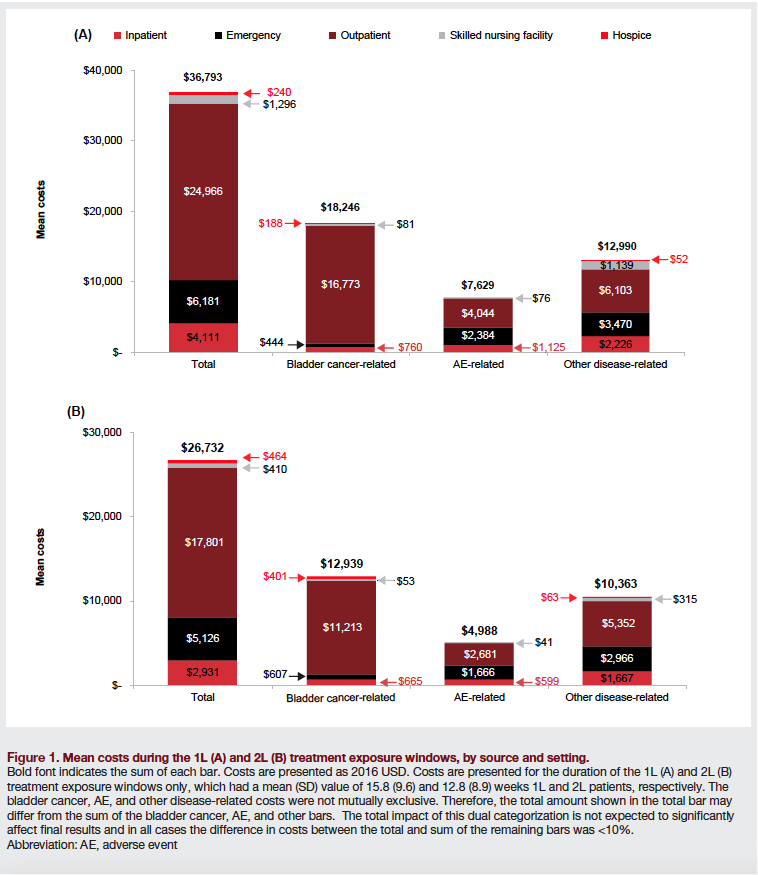
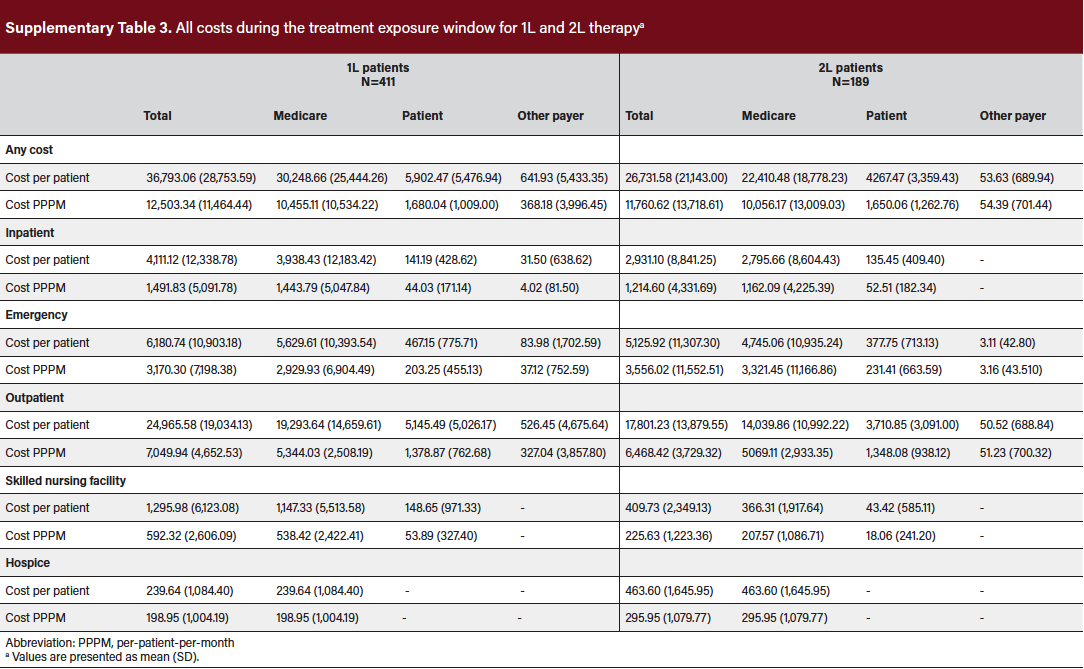
The total costs of cancer care during the 1L and 2L treatment windows were, respectively, $36,793 and $26,732 (Figures 1A and 1B), which corresponded with $12,503 and $11,761 PPPM, respectively (Supplementary Table 3). Care related to bladder cancer was the largest contributor to costs of both 1L ($18,246) and 2L ($12,939) treatment (Figure 1A and Figure 1B). AE–related costs were $7629 for 1L and $4988 for 2L treatment and other disease-related costs were $12,990 for 1L and $10,363 for 2L treatment. Cost incurred in the outpatient setting dominated bladder cancer–related costs of 1L and 2L treatment but made up only approximately half of AE–related costs and less than half of other disease-related costs, where emergency department and inpatient costs increased in importance. Mean Medicare, patient, and other-payer costs were $30,249 (82%), $5902 (16%), and $642 (2%) for 1L treatment and $22,410 (84%), $4267 (16%), and $54 (0%) for 2L treatment (Supplementary Table 3).
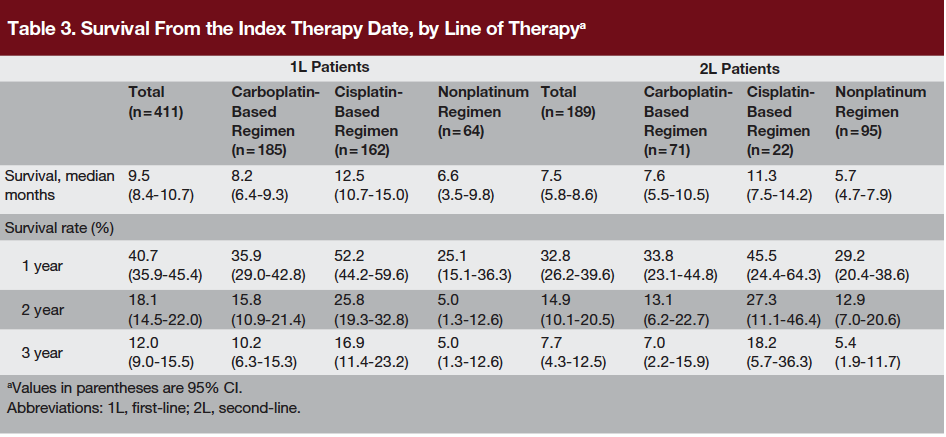
Survival
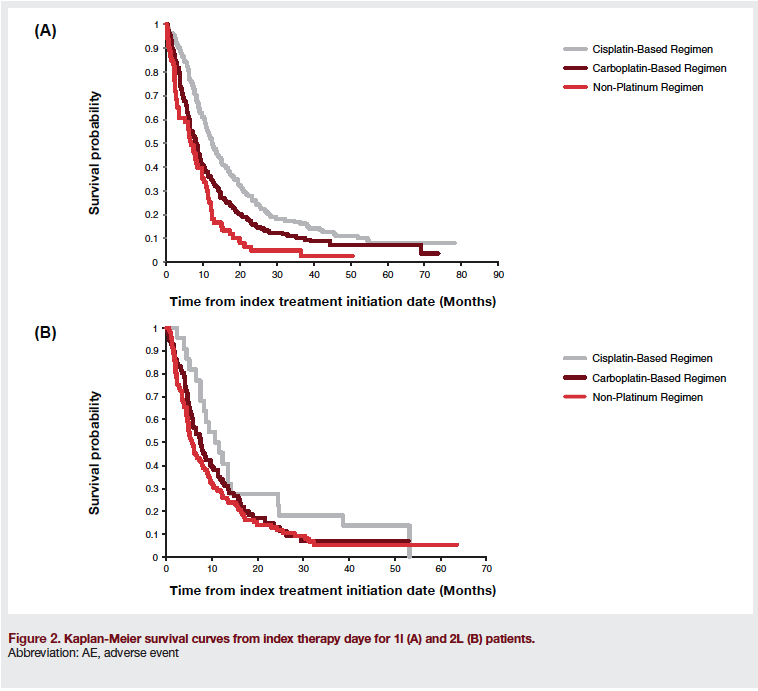
Figures 2A and 2B show the Kaplan Meier curves for survival from the index therapy date. Median survival from index therapy date for 1L patients was 9.5 months (Table 3). Survival rates at 1, 2, and 3 years were 40.7%, 18.1%, and 12.0%, respectively. For patients receiving 2L treatment, median survival from the 2L index therapy date was 7.5 months, and 1-, 2- and 3-year survival rates were 32.8%, 14.9%, and 7.7%, respectively (Table 3).
DISCUSSION
This study reported treatment patterns, health care visits, costs of cancer care, and survival for patients receiving chemotherapy for advanced bladder cancer, based on the most recently available SEER-Medicare data sets. Approximately one-third (34%) of patients diagnosed with advanced bladder cancer received 1L chemotherapy, and about 1 in 6 patients received both 1L and 2L chemotherapy. Platinumbased regimens were used in most patients (84%) for 1L treatment, though cisplatin-based regimens, the recommended standard of care, were used in fewer than half of 1L cases (39%). These treatment patterns differ somewhat from those reported in previous studies.4,5 Rose and colleagues reported treatment patterns among 23,981 patients with stage IV bladder cancer in the National Cancer Data Base from 1998 to 2010.5 Approximately half of these patients received systemic chemotherapy: 45% of males and 52% of females.5 In a previous analysis of SEER-Medicare data from 1992 to 2003, 57% of patients with stage IV bladder cancer received systemic chemotherapy.4
Nonplatinum regimens predominated, however, with gemcitabine and paclitaxel together accounting for 48% of claims in 2003, and carboplatin accounting for 22% of claims (for neoadjuvant, adjuvant, or palliative chemotherapy).4 Costs of early-stage (ie, superficial, or nonmuscle invasive) bladder cancer have been determined in previous analyses of SEER-Medicare data sets for the period 1993 to 2003, with costs given in USD 2005 to 2006.6-8 These studies indicate that the cost of care increases with increasing cancer stage. The average Medicare cost per patient for patients with stage 0 or I bladder cancer were reported as $47446 and $76427 in the 2 years following diagnosis. Costs of bladder cancer based on 1994 to 1996 SEERMedicare data were reported by Cooksley and colleagues.8 The total mean annual cost per patient of nonmuscle invasive and muscle-invasive bladder cancer were $22,088 and $58,074, respectively.8 The costs described here for 1L and 2L therapy for advanced bladder, which exceeded $60,000 per patient in 2016 USD, are much greater than the costs of treating early-stage bladder cancer but are comparable to those for other metastatic cancers in the United States. The overall treatment costs in USD 2014 for a course of treatment of metastatic pancreatic cancer with combination chemotherapy regimens were in the range $46,000 to $67,000.9 The direct medical cost in an incident cohort of women with metastatic breast cancer was reported as $75,415 per patient-year over 5 years.10
The total costs of care for advanced bladder cancer should be weighed against the clinical outcomes likely to be achieved: neither 1L nor 2L patients in this study experienced a median survival beyond 1 year following treatment initiation. Chemotherapy-naive patients may not fully understand the risks and benefits of their treatment options. Clinicians have a duty to initiate difficult conversations about AEs, toxicity, and overall survival prognosis with patients to ensure that their patients are well-informed about their disease and the treatment options available.
In the present study of patients diagnosed with advance bladder cancer, the median survival from the 1L and 2L index therapy dates was 9.5 months and 7.5 months, respectively. These results are similar to results of clinical trials in which median overall survival with 1L systemic therapy was in a range of 8.1 to 15.8 months and 2L was 4.6 to 6.9 months.11 Furthermore, in the National Cancer Data Base study already cited, the overall survival for men and women was 9.8 and 8.0 months, respectively.5 Median survival in the present study was 12.5 months for patients treated with cisplatin-based regimens but only 8.2 months with carboplatin-based regimens and 6.6 months with non-platinum regimens, consistent with evidence from randomized controlled trials showing a significant survival advantage for cisplatin-based combination regimens.5
This observational study was of patients aged 65 years or older with Medicare Parts A and B. The results are not necessarily generalizable to all patients with advanced bladder cancer. However, given that the median age at the diagnosis of bladder cancer is 73 years, the Medicare population includes most of the patients likely to be diagnosed with bladder cancer.1 Another limitation was that it was descriptive in nature and did not include any statistical comparisons of outcomes for the different treatment regimens. The current study also analyzed costs during a 6-year period but did not examine time trends.
CONCLUSION
One-third of patients diagnosed with advanced bladder cancer received 1L chemotherapy, with an average cost of care of about $37,000 per patient. About 1 in 6 patients received both 1L and 2L chemotherapy, at an average cost of care exceeding $60,000 per patient, with more than $10,000 of this sum being paid by the average elderly patient finishing 2L therapy. These costs of chemotherapy for advanced bladder cancer determined from the most recently available SEER-Medicare data sets are approximately in line with those reported for other metastatic cancers and are several times higher than costs of treating early-stage bladder cancer determined from previous analyses of SEER-Medicare data sets. Median survival from the index therapy dates was less than 12 months. These data represent a baseline against which to assess the costs and benefits of new immunotherapies likely to emerge in the coming years.
References:
- Howlader N, Noone AM, Krapcho M, et al. SEER Cancer Statistics Review, 1975-2014. Bethesda, MD: National Cancer Institute; 2017.
- Guancial EA, Roussel B, Bergsma DP, et al. Bladder cancer in the elderly patient: challenges and solutions. Clin Interv Aging. 2015;10:939-949.
- Siegel RL, Miller KD, Jemal A. Cancer Statistics, 2017. CA Cancer J Clin. 2017; 67(1):7-30.
- Porter MP, Kerrigan MC, Donato BM, Ramsey SD. Patterns of use of systemic chemotherapy for Medicare beneficiaries with urothelial bladder cancer. Urol Oncol. 2011;29(3):252-258.
- Rose TL, Deal AM, Nielsen ME, Smith AB, Milowsky MI. Sex disparities in use of chemotherapy and survival in patients with advanced bladder cancer. Cancer. 2016;122(13):2012-2020.
- Hollingsworth JM, Zhang Y, Krein SL, Ye Z, Hollenbeck BK. Understanding the variation in treatment intensity among patients with early stage bladder cancer. Cancer. 2010;116(15):3587-3594.
- Strope SA, Ye Z, Hollingsworth JM, Hollenbeck BK. Patterns of care for early stage bladder cancer. Cancer. 2010;116(11):2604-2611.
- Cooksley CD, Avritscher EB, Grossman HB, et al. Clinical model of cost of bladder cancer in the elderly. Urology. 2008;71(3):519-525.
- Goldstein DA, Krishna K, Flowers CR, et al. Cost description of chemotherapy regimens for the treatment of metastatic pancreas cancer. Med Oncol. 2016;33(5):48.
- Sorensen SV, Goh JW, Pan F, et al. Incidence-based cost-of-illness model for metastatic breast cancer in the United States. Int J Technol Assess Health Care. 2012;28(1):12-21.
- Del Bene G, Sternberg CN. Systemic chemotherapy in muscle invasive and metastatic bladder cancer: present and future. Urologia. 2017;84(3):130-141.

