EP 101: Principles of Electrode Recordings
© 2024 HMP Global. All Rights Reserved.
Any views and opinions expressed are those of the author(s) and/or participants and do not necessarily reflect the views, policy, or position of EP Lab Digest or HMP Global, their employees, and affiliates.
EP LAB DIGEST. 2024;24(4):18-22.
Kriegh Moulton, MD, Director/Faculty, Critical Care Education, Calistoga, California
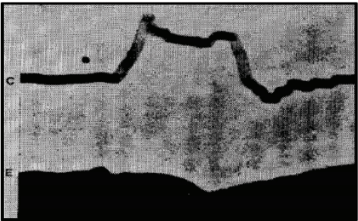
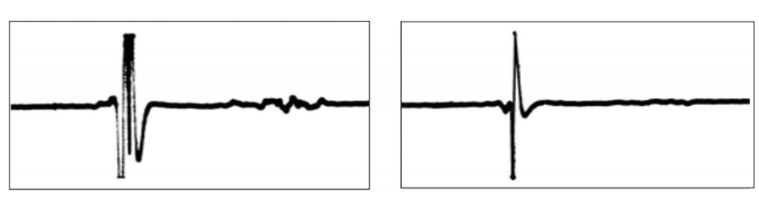
The term “electrogram” was coined by Augustus Waller in 1887 to describe the deflections of the surface electrocardiogram (ECG). The first ECG recording in man, which Waller obtained using a modified Lippmann’s capillary electrometer, is shown in Figure 1. In the following year, he referred to them as cardiograms. Today, an electrogram refers to a localized intracardiac recording reflecting the timing of impulse arrival at the site of a recording electrode pair (Figure 1).
Unipolar Recordings
Contrary to its name, unipolar recordings use 2 electrodes to record an electrogram. One of them, the different electrode, is placed directly on the tissue of interest, while the other, the indifferent electrode, is located “virtually” by unique circuitry (the Wilson Central Terminal) that provides a reference for the different electrode. The 2 electrodes are remote enough from each other that the different electrode’s signal is processed as a single “positive” electrode. Its most common application includes leads aVR, aVL, and aVF, the unipolar limb leads of the frontal plane of a 12-lead ECG.
The different electrode is positioned against the myocardium to record an electrogram. At an impulse’s wavefront, an electric field effect is created by the current flowing from the area of depolarized cells to the area immediately in front of the leading edge of the wavefront. A positive deflection is thereby recorded as a wavefront approaches, while a negative deflection trails the wavefront as it passes over the different electrode.
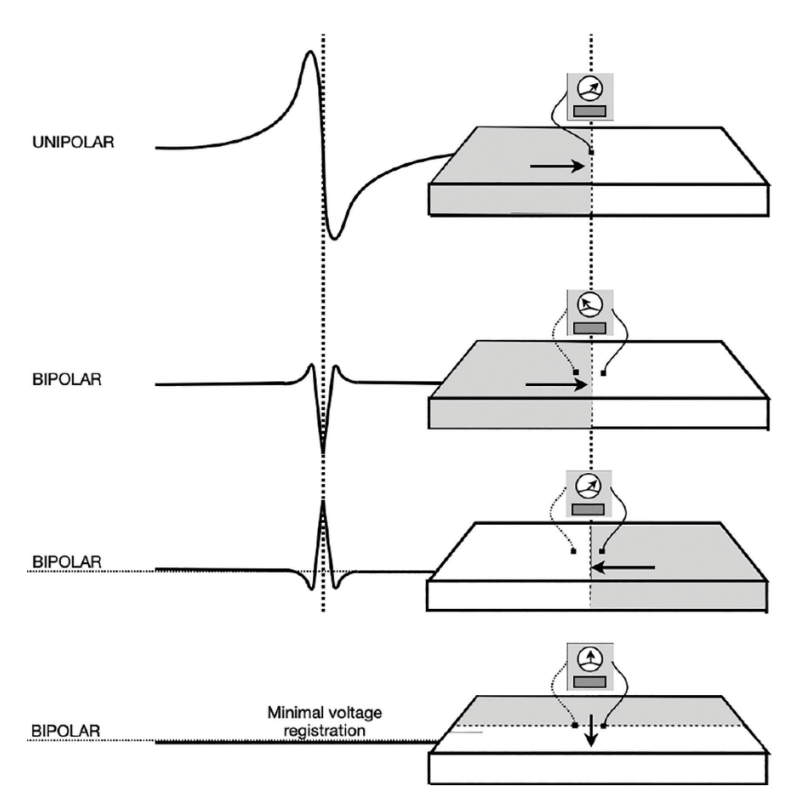
As Figure 2 shows, the wavefront approaches the unipolar electrode with its positive charge facing the electrode producing the initial positive deflection. As the leading edge passes the electrode, a rapid negative deflection develops as the electrode now instantaneously “sees” the negative tail of the wavefront. The voltage change is extremely rapid because the wavefront is no longer in an “approaching” attitude; rather, it is as close to the action as it can get. As the wavefront continues, the measurable (negative) voltage more gradually drops off, producing a biphasic deflection.
The Unipolar Recording as an Indicator of Activation Timing
An important feature of the unipolar recording is the steepest portion of the negative deflection, known as -dV/dtmax. The -dV/dtmax refers to the maximum negative slope of the recorded electrogram. It denotes the moment the wavefront passed by the electrode, illustrating its utility in establishing activation timing.
The Unipolar Recording as an Indicator of the Impulse Site of Origin
When placed at the site of impulse origin, the electrogram has no initial positivity because, at such locations, the electrode will only see the trailing edge of the wavefront. The absence of an “R” or “r” wave indicates that the electrode is at the site of origin of an arrhythmia arising from a focal mechanism. This is taken to indicate the site of ablation success.
Bipolar Recordings
The top diagram in Figure 2 depicts a unipolar recording, using a single (positive) electrode, while the other 3 are bipolar. The orientation of the bipolar electrodes remains unchanged to highlight their ability to register impulse direction, recorded as an inverted, upright, or diminutive deflection depending on the wavefront direction.
The pair of electrodes used for intracardiac bipolar recordings function like the pair of ECG skin electrodes, such as lead I (produced by electrodes placed on the wrists), with some important differences. The catheter’s electrodes are miniaturized, separated by only 2-4 mm, and located inside the heart in direct contact with cardiac tissue. Their signal filtering is also different. Common to both is the arbitrary assignment of one electrode as positive and the other as negative, analogous to a voltmeter’s red and black probes. It is the orientation of the 2 electrodes forming a tiny “surface ECG lead axis” that discloses impulse propagation direction. (Figure 2)
The lead “axis” refers to an imaginary line connecting the electrode pair. A wavefront traveling parallel to it produces a maximum positive if traveling from the negative to the positive electrode. It produces a negative deflection when traveling from the negative toward the positive electrode. If the wavefront travels perpendicular to the interelectrode axis, the recording will theoretically have an amplitude of zero. Since this rarely occurs, there is usually at least a small or biphasic deflection.
The Bipolar Recording as an Indicator of Impulse Direction
It is with this lead axis notion that a bipolar recording provides information concerning impulse propagation direction. One of the best examples using this particular recording trait is what Warren Jackman, MD, took advantage of in attempting to localize a left-sided accessory pathway (AP) in 1988.3 The effort paved the way for a new era in cardiac electrophysiology (EP). It would also introduce electrogram morphology, a feature not commonly appreciated at the time. In this instance, a unique morphology would reproducibly and precisely point to the target necessary for successful radiofrequency ablation of APs. This was the beginning of a new era for interventional EP.
He used the orthogonal catheter in which the electrode arrangement differs from that of the standard EP catheter. Rather than placing electrodes along the length of the catheter body, 4 electrodes are arranged axially around the circumference of the catheter body, forming a quartet. Any 2 adjacent electrode pairs belonging to a quartet can be selected to record local activation.
If a standard coronary sinus (CS) catheter is used to record the passage of an impulse through an AP, its bipolar electrode axis would be perpendicular to the direction of the AP wavefront, making it difficult to record its activation. The orthogonal electrode arrangement places the electrode axis parallel to the direction of an impulse traversing a left-sided AP direction, unmasking the presence of an “AP potential.”
It was not just about whether an AP potential could be recorded, its identity required proof, disclosed by resetting techniques using late-coupled atrial or ventricular extrastimuli. Using the orthogonal catheter, such techniques could show impulse delay or block (a dissociated state) between the atrial muscle and an AP or between the ventricular muscle and an AP, proving the AP potential to be neither of atrial nor ventricular origin. Electrogram morphology is not usually a matter of interest, but the unique morphology of the combined atrial, AP, and ventricular potentials would point the way for the ablation catheter tip.
The Bipolar Recording as an Indicator of Near-Field Activation
A second feature of the bipolar recording is that it primarily records “near-field” tissue activation, excluding activation in more remote areas, particularly when using close electrode spacing. Any far-field activation exhibits lower amplitude and frequency content and can be ignored. Near-field activation produces the characteristic sharp deflection with greater amplitude. This helps in clarifying whether a propagated event is close to the recording electrode.
For example, during any 3-dimensional mapping procedure and when mapping in the neighborhood of fractionated, low-amplitude activity, it can be difficult to decide which electrogram to pick that indicates a particular site’s activation timing. When overreading the recording system’s interpretation, an initial approach is to pick the biggest, sharpest signal to characterize how the impulse is traveling through that region, complete the map, and then review it. Some additional fine-tuning may be necessary.
Unipolar and bipolar recordings should be used together as they complement each other in sorting out what an electrogram tells us.
Interelectrode Distance
Interelectrode distance ranges from 2 to 10 mm. If the distance is much greater than 10 mm, the recording begins to approach that of a “unipolar” arrangement, although the circuitry is not the same. The greater the interelectrode distance, the larger the “field of view” seen by the electrode pair and the more complicated the recording appears. Wide electrode spacing is undesirable because it includes more information than is needed. Wide spacing also widens the electrogram.
The goal is to establish the timing of a wavefront’s arrival at a specific myocardial site as accurately as possible. Narrow interelectrode distances of 2 mm ensure a well-focused view of a small area of tissue surrounding the electrode pair and allow for easy discrimination of local activation from more remote regions (Figure 3).
Because the right-hand electrogram records a smaller region of tissue undergoing activation, its amplitude and duration are smaller, making a timing measurement much easier. Less is better. Close spacing also provides a “cleaner” signal. In some patients, the CS, or portions of it, can be as much as 2 cm away from the annulus, prompting one to widen the interelectrode spacing if ventricular activation timing is important to know.
Signal Filtering
All signals of cardiac origin contain a range of frequencies, whether recorded with a surface ECG or a multichannel intracardiac recording system. The higher frequency content represents the more rapidly changing portions (QRS complex or electrogram), while the lower frequency content is appropriate for recording the P and T waves. Through filtering, frequency content that best defines the preferred events can be chosen.
With intracardiac recordings, high-frequency content is relevant because the information being sought is the timing of activation. Filters have a “cutoff” above or below which certain frequencies can either enter the recording system’s amplifiers or become excluded, respectively.
The High Band-Pass Filter (HBPF)
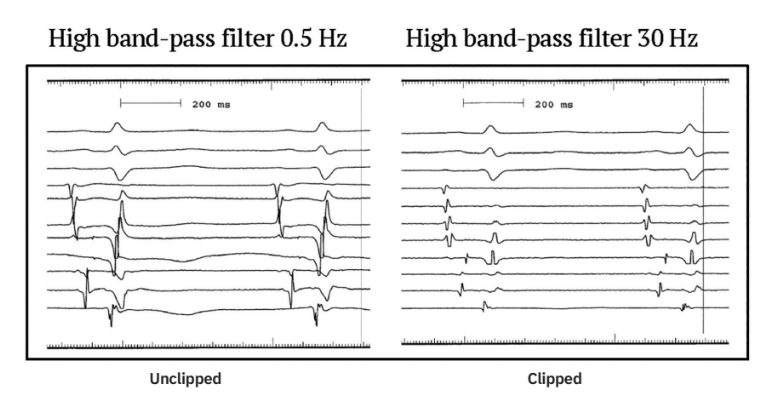
The HBPF accepts higher frequencies for display on the monitor. It may be desirable to exclude low frequency and accept high frequency, both accomplished with the HBPF depending on the cutoff frequency value. Given a typical HBPF cutoff value of 30 Hz, only frequencies higher than 30 Hz appear on the display monitor. Raising the cutoff to 100 Hz would eliminate the 60 Hz interference, but by doing so, an undesirable loss of gain in the signal would occur, so it is kept at 30 Hz. (Figure 4)
In the case of an ECG, lower frequencies (P wave, T wave, ST segment) are desirable, accomplished by lowering the cutoff to 0.1-0.5 Hz. Although this cutoff invites baseline wander, it brings another disadvantage that can be a more serious problem.
There is often a need to cardiovert a patient because of the induction of hemodynamically unstable tachycardia. Cardioversion is such an energetic event that it causes any ECG tracing to go missing for at least 10-15 seconds before the post-conversion rhythm becomes recognizable again. This requires directing attention to the intracardiac recordings, specifically the right ventricular (RV) recording because its filtering ensures the tracing faithfully remains in place.
The Low Band-Pass Filter
The low band-pass filter is not as important. It can be set to enable low-frequency content to enter the amplifiers, which is more important when recording the ECG. Although for intracardiac recordings we are mainly interested in the higher frequency content, there is no incremental benefit in displaying higher frequencies, so 500 Hz is chosen for the low band-pass cutoff. Thus, the desired frequency content of any intracardiac electrogram will be found in the overlap zone between the 2 cutoffs, 30-500 Hz.
Clipping
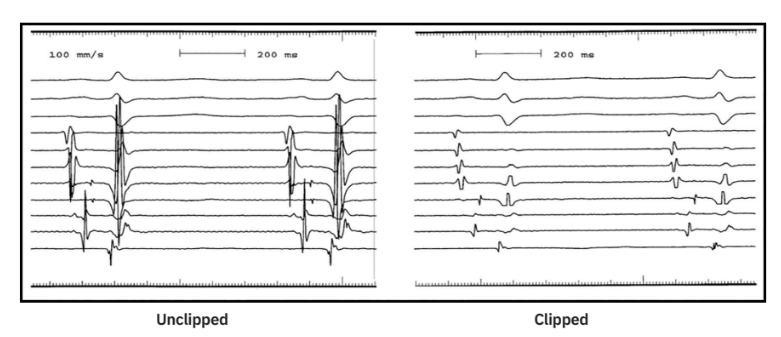
Clipping is accomplished by “limiters,” which reject any signal above a given voltage, whether positive or negative. Thus, the excursion of the signal being displayed is limited in how far it can travel above or below the baseline. The main reason to clip is to eliminate the untidy and confusing signal overlap between adjacent channels often seen and evident in the left-hand tracing of Figure 5. The right-hand tracing is from the same patient a few seconds later. It is clipped and ready for show. Clipping does not alter signal gain or frequency content.
Electrogram Nomenclature
• S- Stimulus artifact S1 S2 S3 etc.
• A- Atrial electrogram A A1 A2 etc.
• H- His electrogram H H1 H2 etc.
• V- Ventricular electrogram V V1 V2 V3 etc.
The absence of a subscript following S, A, H, or V means that the recorded electrogram is the local response to a nonpaced impulse, such as that seen with a sinus beat, a junctional or ventricular complex, or during a tachyarrhythmia.
The presence of a numerical subscript indicates that the recorded electrogram is from a paced impulse and without reference to the site of pacing. The subscript 1 refers to responses from a basic pacing train, whether it lasts 8 beats or is continuous. Subscripts 2, 3, and 4 represent the first, second, and third premature responses, respectively.
An A1-A1 interval refers to 2 consecutive atrial responses to pacing originating from any location. For example, the source of pacing could be the RV apex (V1-V1), but the response of interest is that which is occurring in the atria, the A1-A1 interval.
Similarly, V1-V2 represents a premature response (V2) recorded in the ventricle coupled to a basic response (V1), also recorded in the ventricle. Again, there is no disclosure of the pacing source. The impulse could have arisen in either the atria or ventricles.
The subscript “e” refers to a response representing an echo beat. An echo is a spontaneously appearing impulse emitted from a reentrant circuit in response to a premature beat, often mistaken for an unrelated, fortuitously timed premature beat. An Ae is an atrial echo beat. The reentrant circuit producing it could be anywhere, but it represents the impulse’s return trip to the atria. It is most commonly used in reference to atrioventricular (AV) nodal beats, or AV re-entrant echoes in the case involving an AP.
The value of the electrogram nomenclature is its shorthand format used for writing or speaking. Rather than spending several sentences describing what is being paced or what responses to pacing are seen, abbreviations are used.
The Tracing Display Sequence on a Recording System: Order or Disorder?
The program providing EP training will determine how the tracing order is displayed on the screen in the lab. Still, the following guidelines have become commonplace over the past 30 years. While lab-to-lab differences exist, all have the same goal: to create a form of “pattern recognition,” collectively, with the electrograms, and, in particular, all of the atrial electrograms. This is important when displaying up to 16 channels of recordings.
Surface ECG recordings are generally placed in the top 3 or 4 channels on the screen. At least 3 surface ECG leads should be provided. They should be “orthogonal” to each other, meaning that each should represent a different anatomic plane, one from the frontal plane and one from the horizontal plane. There are no current sagittal plane representations of an ECG, so leads I, II, and V1 are most frequently used.
The intracardiac recordings occupy the channels below the surface ECG recordings. Their order is based on the sequence of activation taking place during normal sinus rhythm. Thus, the right atrial appendage (RAA) recording should occupy the top channel and the RV recording should appear at the bottom. In between, and in the order of the normal activation sequence, are the His tracing, the CS os tracing, and the more distal CS tracings.
Because it may be necessary to quickly recognize the AV relationship amid an unexpected rhythm change, a common approach was to place the RAA and RV recordings in adjacent channels to have an immediate picture of what is going on in the atria and ventricles under any circumstance. For example, following induction of a tachycardia, more A’s than V’s = an atrial tachycardia; more V’s than A’s = ventricular tachycardia. However, the surface QRS complex (V1), located adjacent to the RAA electrogram, will always provide that unmistakable “V” timing.
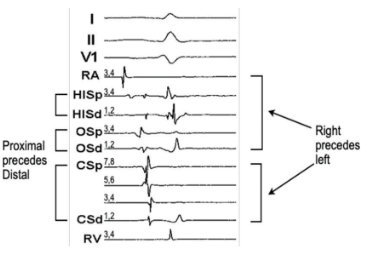
Regarding right vs left heart, the right-sided tracings should be placed above those representing left-sided tracings because their activation precedes the left.
The final organizational factor involves where to place the more proximal electrode pairs relative to the distal ones on the His and coronary sinus catheters. In both, the normal sequence of activation is always “proximal to distal”, which dictates that the proximal pair occupies a channel higher up on the screen than the distal pair.
In Summary
• The atrium precedes the ventricle. Within the atrium, RAA precedes His, His precedes CS os, and CS os precedes more distal CS recordings.
• Right-sided activation precedes left-sided activation.
• Proximal electrode pairs precede distal electrode pairs when on the same catheter.
The tracing set in Figure 6 is from an EP study in which 5 intracardiac catheters were used. Three surface ECG leads are shown. The RAA recording occupies the top-most intracardiac channel. The numerical designation of each electrode pair is shown on the left side of the tracing. Electrode pair #1-2 is not displayed for either the RAA or RV catheters because that electrode pair is dedicated to delivering the pacing stimulus and is not necessary to display.
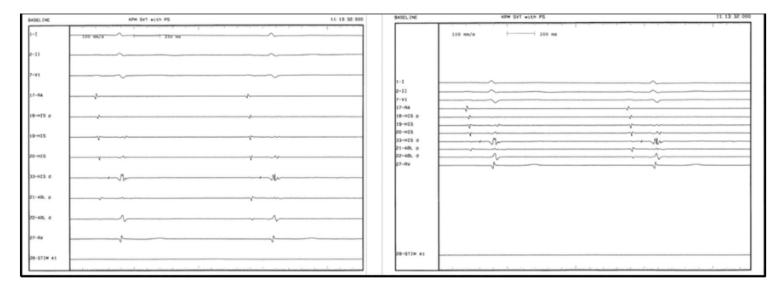
Condensing the Tracings on the Monitor Screen
The channels on the monitor should be spaced more closely than farther apart.
By positioning the channels on the monitor closer together, the activation sequences of interest will be easier to see. In turn, this enables an appreciation of the bigger goal of recognizing a collective “pattern of activation” consistent with a certain tachycardia mechanism (Figure 7).
The question being asked is “How does the timing of an electrogram on one channel relate to that on a nearby channel—does it precede or follow it?” For example, is the activation pattern consistent with retrograde conduction via the fast AV nodal pathway, the slow, or neither in the case of an AP? Closer channel spacing makes it easier and quicker to form an opinion if the electrogram relationship is compatible with a diagnosis. As we are always more interested in atrial electrograms, it is important to know how they all appear collectively.
Intracardiac Interval Measurements
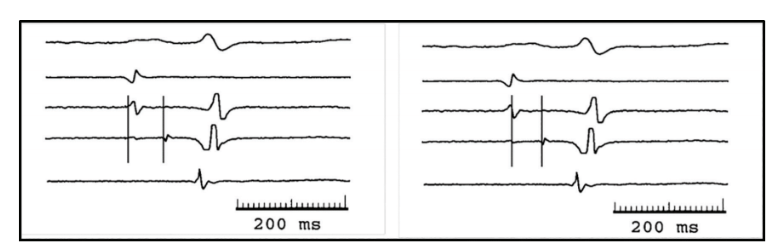
The A-H interval
Two ways to measure the A-H interval are shown in Figure 8. Electrogram onset is most commonly used (left-hand panel). It reflects the timing of the approaching wavefront as it arrives very close to the electrode pair. Slurring of the electrogram’s upstroke can make it difficult to precisely note the “onset of the onset,” worsened with wide-spaced electrodes or too rapid a sweep speed (Figure 8).
The method shown in the right-hand panel is the zero-crossover point or the steepest part of the electrogram. It could be a better alternative to the onset method because it suggests the moment when the leading edge of the wavefront passes beneath the 2 electrodes, but that would be the job of the unipolar recording.
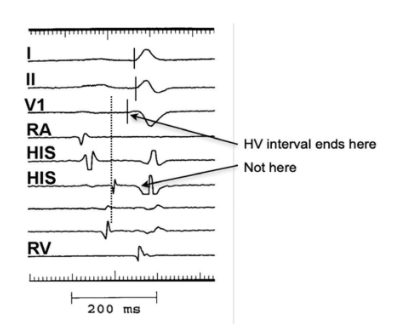
The H-V interval
The H-V interval measurement begins with the onset of the His potential (vertical dashed line). The end of the H-V coincides with the onset of ventricular activation represented by the earliest surface QRS onset, not the onset of the intracardiac ventricular electrogram that accompanies the His potential. Of the 3 surface ECG QRS complexes, the one with the earliest onset QRS is the correct complex to use, V1, in Figure 9. If lead I or II is used, the H-V interval would be erroneously long (Figure 9).
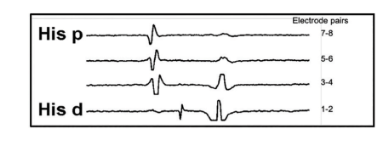
Annular Recordings
An annular recording is made when an electrode pair lies on the annulus. Whether tricuspid or mitral, it is always recognized by the presence of both an atrial and ventricular electrogram recorded by the same electrode pair. The His bundle and CS catheters lie on the annulus, and therefore, have both an atrial and ventricular electrogram (Figure 10).
The closer a recording electrode pair is to the ventricular side, the larger its ventricular potential (tracing His d); the closer an electrode pair is to the atria, the larger the atrial electrogram (tracing His p). Pair 3-4 is “balanced” and best represents an annular recording. Close electrode spacing facilitates this type of resolution.
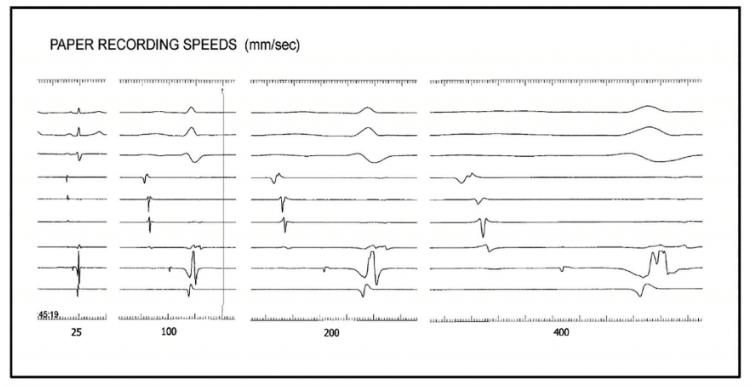
Paper or Sweep Speed
Accurate interval measurement depends on the quality of the recorded electrogram, interelectrode spacing, proper filtering, and recording speed. Too slow a sweep speed results in signal crowding and a loss of resolution as to the timing of activation. For example, at sweep speeds of 25-50 mm/sec, an A-H interval measurement may be in error by as much as 20-30 msec.
At sweep speeds >200 mm/sec, the resolution of timing differences might be as little as 1-2 msec, but this level of precision is impractical and leads to increased interobserver variability. More likely, such speeds will result in excessive broadening of the signal with so much slurring of the upstroke that an onset measurement becomes difficult. Sweep speeds of 100-150 mm/sec are ideal because the problems associated with either extreme are minimized.
The appearance of different sweep speeds and their different effects on the ease of electrogram onset measurement are shown in Figure 11. n
Disclosure: The author has completed and returned the ICMJE Form for Disclosure of Potential Conflicts of Interest, and reports no conflicts of interest regarding the content herein.
Related Content