Advancing a Standardized Economic Framework to Power Oncology Pathways: Methods and Model Development From Phase II of the Predictable Cost of Care Working Group
Research Question: How can the cost elements and parameters identified in Phase I of the Predictable Cost of Care (PCC) Working Group be translated into a
transparent, reproducible, and technically-sound methodology that enables pathway developers and manufacturers to generate consistent, comparable predictable cost-of-care estimates across oncology treatment options?
Mission: To develop and refine an industry-standard cost of cancer care model to support pathway treatment decisions that not only calculates the cost of drugs, but also the predictable total costs associated with therapy within labeled indications
Abstract: With an expanding number of cancer therapies entering clinical practice and rapidly escalating costs, pathway developers face increasing challenges in comparing treatment options using consistent and transparent economic criteria. Historically, cost considerations within oncology pathways have focused primarily on drug acquisition costs, often excluding other predictable and clinically meaningful components of care. Phase I of the PCC Working Group established a consensus on the cost domains that should be included in a standardized framework; however, a practical methodology for implementing this framework had not yet been defined. In Phase II, the PCC Working Group convened a multistakeholder panel to translate the Phase I consensus into an operational, reproducible cost model. Through structured deliberations and iterative refinement, the Working Group aligned on model inputs, data sources, technical assumptions, and methods for estimating drug-, administration-, supportive care-, and adverse event-related costs. The resulting model provides a transparent approach to estimating predictable, regimen-specific costs over standardized time horizons and is designed to be generalizable across tumor types and treatment settings. The Phase II PCC model advances the development of an industry-standard methodology for cost comparisons that can support oncology pathway development and value-based treatment decision-making.
Introduction
Spending on oncology therapeutics in the United States has risen sharply over the past decade. In 2023 alone, expenditures on orally-administered and clinician-administered anticancer therapies (excluding supportive care) exceeded $99 billion and are projected to reach $180 billion by 2028.1 In addition to drug costs, medical services associated with cancer are expected to reach $220 million by 2030.2 The growth in costs of anticancer therapies reflects high launch prices, price increases for existing agents, and rapid adoption of novel targeted and immune-based therapies.1 Escalating oncology costs place substantial strain on payers, health systems, and patients, raising concerns about long-term sustainability and equitable access to care.1,3 Despite these pressures, cost assessment within oncology pathways has remained narrowly focused on drug acquisition costs—most commonly average sales price (ASP)—with limited consideration of other predictable cost drivers.
Non-drug costs, including administration, supportive medications, and adverse event (AE) management, can vary substantially between regimens and meaningfully alter the total cost profile of care.3 As treatment paradigms shift toward chronic administration of targeted therapies and immunotherapies, differences in toxicity profiles and supportive care requirements further amplify divergence in predictable costs across regimens.3 A comprehensive, transparent, and standardized economic framework is therefore essential to support value-based decision-making, enable consistent comparisons across treatment options, and align spending with clinical benefit.3
Phase I of the PCC Working Group established a multistakeholder consensus on the core domains that should be included in a predictable cost model for oncology pathways.4 Using a modified Delphi approach, the group agreed to include regimen-specific drug costs, administration costs, and costs associated with severe (grade ≥3) AEs, while excluding baseline diagnostic testing, unrelated comorbidity costs, and terminal care. Phase I also defined foundational modeling principles, including the use of a standardized reference patient, fixed analytic time horizons of 6 and 12 months, and reliance on transparent, publicly available data sources.4 While Phase I clarified what should be included in a predictable cost framework, it did not define how the framework should be operationalized.
Key unresolved issues included the absence of a working technical model, lack of standardized methods for AE cost estimation, and unanswered methodological questions related to dosing assumptions, vial wastage, site-of-care variation, and how to apply AE incidence from clinical trial data. These gaps limited the ability of pathway developers and manufacturers to apply the framework consistently. Phase II was therefore launched to convert the Phase I consensus framework into a functional, testable, and reproducible economic model. Phase II sought to:
-
Define model inputs using transparent and auditable assumptions
-
Align on unit cost sources and utilization assumptions
-
Establish standardized methods for AE cost modeling.
-
Build and pilot a working, indication-agnostic PCC model applicable across cancer types
Phase III of the program will seek to validate feasibility and usability through multistakeholder feedback and assess the ability of pharmaceutical manufacturers to provide consistent, verifiable data to populate the model.
Methods
Workgroup Composition
Phase II convened a multistakeholder panel including pathway developers, clinicians, payers, health economists, pharmaceutical manufacturer representatives, and data scientists. Four structured Working Group meetings were conducted between March and November 2025, building sequentially on Phase I outputs.
Consensus Approach
Unlike Phase I, which employed a modified Delphi process, Phase II used structured, agenda-driven deliberations focused on feasibility, technical specification, and implementation. Iterative refinement was used to resolve methodological questions, assess data availability, and align on standardized assumptions.
Data Sources and Materials
Inputs to Phase II deliberations included the published Phase I consensus framework, US Food and Drug Administration (FDA) package inserts and clinical trial data for dosing and AE incidence, Medicare fee schedules and ASP files for unit costs, and peer-reviewed literature evaluating AE-related costs. The Medicare traditional fee-for-service payment system, a standardized, published, and reproducible model, was used as the basis for costs such as office visits and tests. Given the wide variability in commercial payments, based on underlying contract structure, additional factors would need to be considered to apply this work in a commercial space.5,6
Results
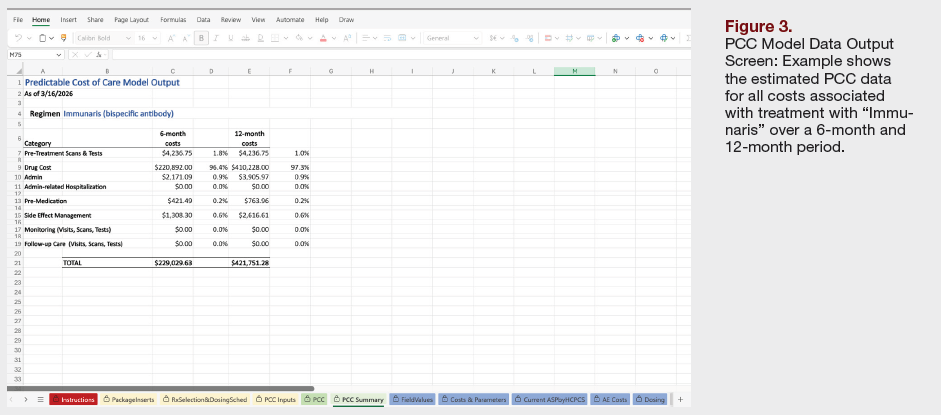
The primary output of Phase II was the development of an operational, standardized PCC model. Results are organized below according to the major model components—including model inputs, exclusions, data sources, and structural features—and are intended to facilitate transparency, reproducibility, and alignment with pathway decision-making needs. The model estimates incremental, regimen-specific predictable cost elements directly attributable to the therapy and does not represent the total cost of a disease state. Costs are estimated over fixed 6-month and 12-month horizons, consistent with the Phase I consensus.4
Standardizing Patient Parameters
To ensure comparability across treatment regimens, the model uses a standardized reference patient. Adult height and weight assumptions were informed by nationally representative anthropometric data from the National Health and Nutrition Examination Survey (NHANES), as reported by the National Center for Health Statistics. Specifically, average adult height and weight values broadly consistent with US anthropometric reference data support the use of a reference height of approximately 170 cm and a reference body weight of approximately 80 kg for modeling purposes.7 For renal function assumptions used for dose calculations, serum creatinine was fixed at 0.8 mg/dL, representing a value within the normal adult reference range.8
Establishment of Two Key Time Horizons
A 6-month horizon was selected to capture early drivers of predictable cost, including initial administration intensity, early toxicity, and regimen-specific monitoring requirements. A 12-month horizon was selected to align with common pathway review cycles and to allow for more meaningful comparisons of cumulative non-drug costs—particularly AE-related costs—over time. Together, these horizons provide complementary views of short-term and intermediate-term predictable cost burden.
Development of an Indication-Agnostic Model
Metastatic non–small cell lung cancer (mNSCLC) was selected as the pilot indication for initial Phase I model development due to its high prevalence and relevance to pathway decision-making. The Phase II working model was developed independent of any specific disease or therapy type and is intended to be applicable to all cancer types and drug/immunotherapy-based treatments.
Model Inputs
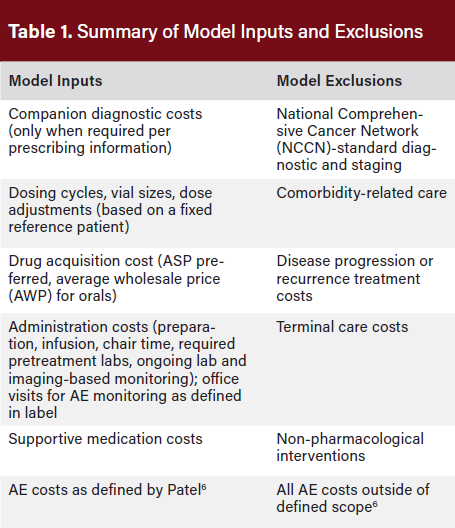
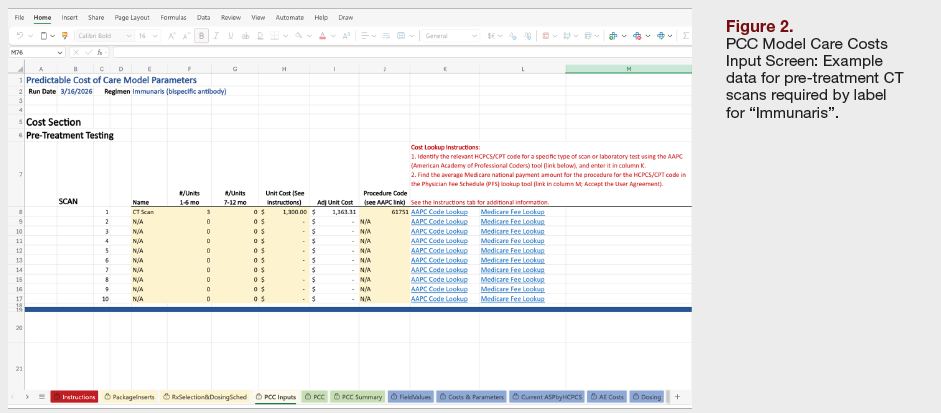
Model inputs were defined to capture predictable, regimen-specific costs while avoiding inclusion of unrelated or downstream expenditures (Table 1). Pretreatment testing was limited to diagnostics described in the product’s prescribing information as required to initiate specific regimens, such as companion diagnostics, whereas routine guideline-directed baseline testing common to all patients was excluded. When included, diagnostic test costs were derived from publicly available reimbursement schedules to ensure transparency and referenceability.
Drug acquisition costs were calculated using ASP as the primary benchmark for clinician-administered therapies, with wholesale acquisition cost (WAC) or AWP used for oral therapies or for newly launched drugs where ASP is not yet available.
The model requires transparent documentation of dose calculations, vial sizes, dose rounding, pill volume, and wastage assumptions, and maintains separate cost tracks for community and hospital outpatient department settings to reflect the finding that hospital outpatient department pricing (HOPD) can be materially higher than community-based care.9
Administration and monitoring costs were defined to include all services directly related to drug delivery and regimen-directed follow-up. These costs encompass infusion preparation and chair time, required pretreatment laboratory testing, and ongoing laboratory or imaging-based monitoring specified by the regimen. Medicare fee schedules were used as the standard source for estimating these costs to promote uniformity and reproducibility across users.
Supportive medication costs were derived from supportive care recommendations included in product prescribing information and from supportive regimens used in pivotal clinical trials. Although the Working Group acknowledged that supportive care frequencies observed in trials may exceed those seen in routine practice, prescribing information-based standards were viewed as offering more consistent and reproducible assumptions for standardized modeling.
Transparency and Auditability
Transparency and auditability were identified as essential design features of the model. Each cost field within the model includes:
- Documentation of the source type
- Year or version of the pricing or utilization data
- Notes describing key assumptions such as dose rounding or monitoring frequency
Calculations are structured to allow users to trace final cost outputs back to their underlying inputs, supporting auditability and confidence in model outputs. The model architecture was also designed to facilitate annual updates as Medicare fee schedules and other public pricing benchmarks are revised.
AE Cost Strategy
A dedicated AE cost strategy was developed to address the challenges associated with incorporating toxicity-related costs into regimen-level comparisons. The Working Group recognized limitations in available data sources, including limited real-world evidence for newly approved therapies, the inability of trial-reported AE incidence to capture recurrence or cumulative burden of AEs, substantial variation in AE management across practice settings, and incomplete mapping of AEs in claims data.
To inform AE cost inputs, the Working Group evaluated two peer-reviewed publications:
- Wong et al. provided foundational estimates across 36 AE categories, offering broad cancer-population representation, but limited differentiation by severity and reliance on older cost estimates.5
- Patel et al. expanded this methodology to 54 AE categories and provided differentiated cost estimates for all AEs and severe AEs using a more contemporary claims-based approach, with strong alignment to a 12-month analytic horizon.6
After evaluating both studies, the Working Group reached a consensus that the Patel et al. dataset6 represents the most complete, scalable, and referenceable source for AE cost inputs, with costs adjusted using the non-seasonally adjusted medical care services index (included within the Consumer Price index [CPI]) to reflect contemporary pricing.10 AEs not represented in this dataset will be addressed through supplemental literature review or expert clinical guidance.
Discussion
Phase II of the PCC Working Group represents a critical inflection point in the evolution of oncology pathway economics, shifting the framework from conceptual agreement to practical application. Whereas Phase I established a consensus on what cost elements should be included in a predictable cost framework, Phase II addressed the more complex and consequential question of how those elements should be operationalized in a transparent, reproducible, and scalable manner.
A central contribution of Phase II was the explicit prioritization of feasibility and auditability alongside methodological rigor. Throughout the Working Group deliberations, panelists consistently emphasized that a well-designed model would have a limited impact if it could not be easily implemented by pathway developers or populated using data that manufacturers could reasonably provide. This emphasis shaped key methodological decisions, including reliance on publicly available unit cost sources, standardized reference patient assumptions, and avoidance of highly customized or claims-intensive modeling approaches in the initial implementation.
One of the most substantive methodological advancements in Phase II was the incorporation of AE costs using a standardized, literature-based framework. While claims-based costing approaches offer greater granularity, they were deemed impractical for routine pathway use due to the complexity of International Classification of Diseases, Tenth Revision (ICD-10) mapping, variability in care patterns, and limited reproducibility across users. The selection of the Patel et al. framework as the primary AE cost source reflects a pragmatic consensus. Importantly, the Working Group acknowledged known limitations of this approach, including reliance on trial-reported AE incidence and the inability to fully capture overlapping, recurrent, or chronic toxicity. These limitations were considered acceptable within the context of a predictable cost model, whose purpose is not to replicate real-world total cost of care, but to enable standardized comparisons across regimens under consistent assumptions.
Phase II discussions also surfaced important considerations regarding site-of-care variation. The inclusion of separate hospital outpatient and community practice fee schedules reflects real-world reimbursement differences that can materially affect administration and supportive care costs. The consensus to include both settings in the initial model, with the option for simplification in future iterations, underscores the program’s iterative philosophy: establish a comprehensive baseline first, then refine based on user experience and stakeholder feedback.
The Working Group also recognized that the PCC model has important future applications beyond pathway development, particularly as value‑based care and oncology contracting models continue to evolve. By providing a transparent, indication‑agnostic structure for estimating predictable, regimen‑specific costs, the model offers a foundation for more consistent economic comparisons that can inform payer–provider alignment, performance‑based arrangements, and manufacturer contracting strategies. Its standardized inputs and auditable assumptions create a common reference point that could help reduce negotiation friction, support the design of shared‑savings or episode‑based models, and enable clearer attribution of cost variation to specific regimen characteristics. As stakeholders increasingly seek tools that balance clinical nuance with operational feasibility, the PCC framework positions itself as a practical bridge between pathway decision‑making and the broader shift toward accountable, value‑aligned oncology care.
At the conclusion of the Phase II meetings, the Working Group aligned on next steps to complete the integration of the AE cost framework, review and test the prototype model using both example datasets and a fillable template and embed source documentation and assumption annotations throughout the model. Development of a step-by-step user guide and iterative refinement based on stakeholder feedback will be completed prior to any public-facing or payer-facing release.
The Phase II PCC model also has several important limitations. By design, the model estimates predictable, regimen‑specific costs only over fixed 6‑ and 12‑month horizons, which may not fully capture the long‑term economic implications of therapies with extended treatment durations or delayed toxicities. In addition, the framework does not address how payers should incorporate fixed‑duration regimens, one‑time high‑cost interventions, or cellular therapies such as CAR‑T into pathway or coverage decision‑making. These modalities introduce unique cost trajectories and care delivery requirements that fall outside the scope of the current model and will require future methodological development to ensure consistent, transparent evaluation across oncology treatment types.
Conclusion
As oncology continues to evolve with increasing use of combination regimens, novel mechanisms of action, and biomarker-driven treatment selection, the need for adaptable yet standardized economic tools will only intensify. Phase II successfully operationalized the PCC framework, delivering a standardized, transparent, and generalizable economic model for oncology pathways. This work provides a foundation for more informed, value-aligned treatment decisions and sets the stage for broader adoption across oncology stakeholders.
Author Information
Affiliations:
1Tennessee Oncology, Nashville, TN, USA; 2Evolent, Arlington, VA, USA; 3McKesson, Irving, TX, USA; 4Dana-Farber Cancer Institute, Boston, MA, USA; 5Kuntz Consulting, Minneapolis, MN, USA; 6Elsevier, Munich, Germany; 7ConcertAI, Cambridge, MA, USA; 8Navista, Dublin, OH, USA
Funding:
Pfizer and AstraZeneca sponsored the Phase II Predictable Cost of Care Working Group, but did not influence the participants’ findings.
Correspondence:
Carole Tremonti, MBA, RN
ctremonti@concertai.com
Acknowledgments:
Medical writing assistance was provided by HMP Collective.
Disclosures:
Andrew Hertler is employed by Evolent Health and holds stock in Evolent Health. Olaf Lodbrok is employed by Elsevier. The remaining authors have no disclosures.
References
- Jazowski SA, Nayak RK, Dusetzina SB. The high costs of anticancer therapies in the USA: challenges, opportunities and progress. Nat Rev Clin Oncol. 2024;21(12):888-899. doi:10.1038/s41571-024-00948-1
- Mariotto AB, Enewold L, Zhao J, et al. Medicare care costs associated with cancer survivorship in the United States. Cancer Epidemiol Biomarkers Prev. 2020; 29(7):1304-1312. doi: 10.1158/1055-9965.EPI-19-1534
- Tran G, Zafar SY. Financial toxicity and implications for cancer care in the era of molecular and immune therapies. Ann Transl Med. 2018;6(9):166. doi:10.21037/atm.2018.03.28
- Arrowsmith ER, Golla V, Henschel R, et al. Predictable cost of care model for treatment decisions: working group consensus statements for metastatic non-small cell lung cancer. J Clin Pathways. 2025;27(4):27-32
- Wong W, Yim YM, Kim A, et al. Assessment of costs associated with adverse events in patients with cancer. PLoS One. 2018;13(4):e0196007. doi:10.1371/journal.pone.0196007
- Patel A, Schuldt R, Sussell J. New estimates of the costs of adverse events in patients with cancer. PLoS One. 2025;20(9):e0332703. doi:10.1371/journal.pone.03327031
- Fryar CD, Gu Q, Afful J, Carroll MD, Ogden CL. Anthropometric reference data for children and adults: United States, August 2021–August 2023. Vital Health Stat. 2025;3(50):1-26. doi:10.15620/cdc/174595
- Lewin J. What are normal levels of creatinine, and how are they tested? Medical News Today. Updated March 27, 2025. Accessed January 27, 2026. https://www.medicalnewstoday.com/articles/322380
- Godwin J, Arnold DR, Fulton BD, Scheffler RM. The association between hospital-physician vertical integration and outpatient physician prices paid by commercial insurers: New evidence. Inquiry. 2021;58:46958021991276. doi:10.1177/0046958021991276
- U.S. Bureau of Labor Statistics. CPI Inflation Calculator. Accessed January 27, 2026. https://www.bls.gov/data/inflation_calculator.htm