




Aortic Valve Calcification and One-Year Paravalvular Leak After Transcatheter Aortic Valve Replacement: Limited Role of Asymmetry
© 2026 HMP Global. All Rights Reserved.
Any views and opinions expressed are those of the author(s) and/or participants and do not necessarily reflect the views, policy, or position of the Journal of Invasive Cardiology or HMP Global, their employees, and affiliates.
J INVASIVE CARDIOL 2026. doi:10.25270/jic/26.00241. Epub November 9, 2026.
Key Clinical Summary
- Higher total aortic valve calcification on preprocedural computed tomography identified patients at increased risk of paravalvular leak 1 year after transcatheter aortic valve replacement.
- Calcification asymmetry between valve leaflets did not improve prediction of paravalvular leak beyond overall calcification burden.
- Quantifying total aortic valve calcification may improve preprocedural risk stratification and guide procedural planning to reduce paravalvular leak.
Abstract
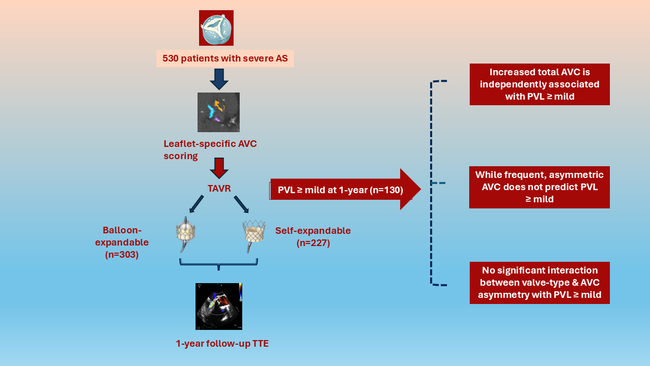
Objectives. Paravalvular leak (PVL) is a significant complication after transcatheter aortic valve replacement (TAVR). Although total aortic valve calcification (AVC) burden and self-expandable valves are predictors of PVL, the impact of leaflet-specific AVC asymmetry remains uncertain. The authors evaluated the association between AVC asymmetry and mild or greater PVL at 1 year after TAVR and its interaction with valve type.
Methods. Patients undergoing TAVR between January 2022 and May 2025 with preprocedural noncontrast cardiac computed tomography and 1-year transthoracic echocardiography were included. Asymmetric AVC was defined as greater than 50% of total AVC on a single cusp.
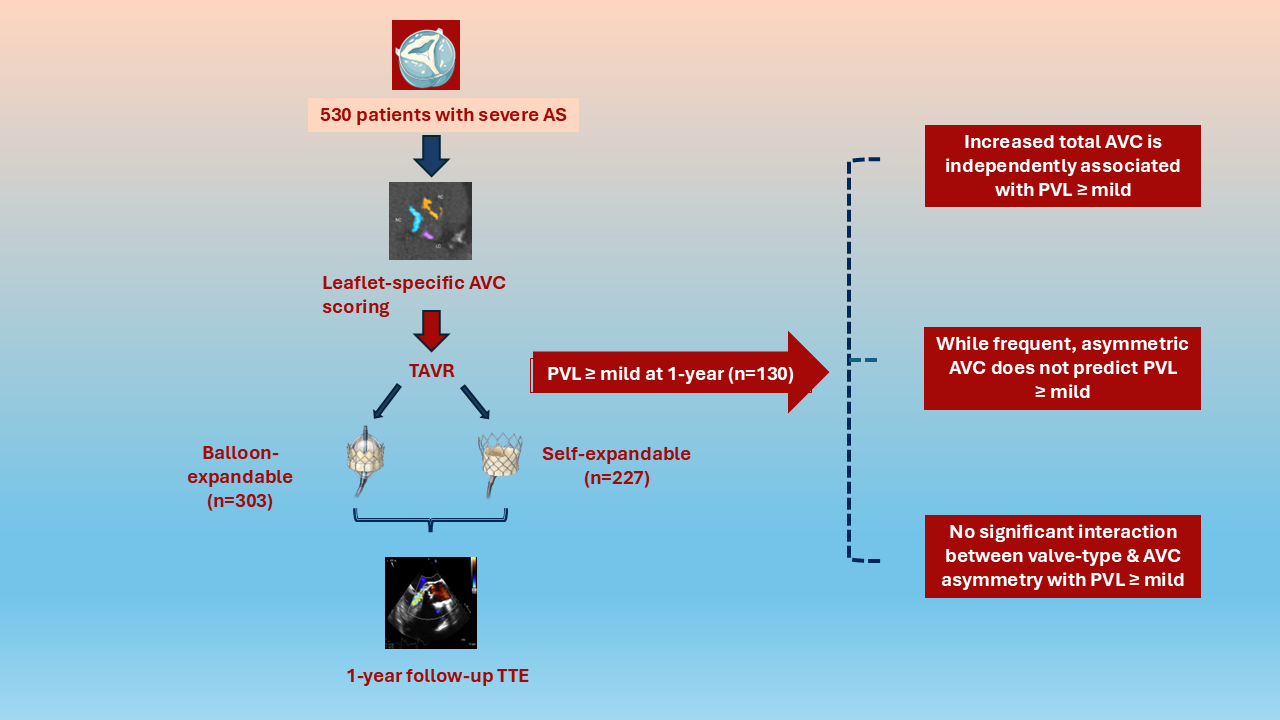
Results. Among 530 patients (mean age, 79 ± 8 years; 45.5% female), 130 (24.5%) had mild or greater PVL at 1 year. Total AVC was higher in women (1747 vs 1125 AU; P < .001) and men (2612 vs 2063 AU; P < .001) with mild or greater PVL, with greater calcification across all cusps. AVC asymmetry was comparable between PVL and non-PVL groups (33.1% vs 41.4%; P = .093). Total AVC independently predicted PVL (adjusted odds ratio [OR], 1.036 per 100 AU; P < .001), whereas asymmetry did not (adjusted OR, 0.912; P = .681). No significant interaction occurred between valve type, AVC asymmetry, and PVL (P = .224).
Conclusions. Total AVC independently predicts mild or greater PVL at 1 year after TAVR, whereas leaflet-specific asymmetry and valve type provide no additional predictive value.
Introduction
Transcatheter aortic valve replacement (TAVR) has become an established treatment for patients with severe symptomatic aortic stenosis (AS). Despite major procedural advances, paravalvular leak (PVL) remains a clinically relevant complication after TAVR, and even mild PVL has been linked to increased all-cause mortality.1-3
Several patient and procedure-related factors influence PVL after TAVR.1,4-6 Among these, total aortic valve calcification (AVC) burden quantified by cardiac computed tomography (CT) has emerged as an independent predictor of PVL, with higher AVC associated with increased risk of PVL in both sexes.7-9 However, the impact of leaflet-specific AVC and AVC asymmetry remains less clear, and was only examined in smaller studies that differed in their approaches to AVC quantification.8,10,11 Moreover, these studies predominantly assessed PVL at early follow-up, leaving the relationship between calcification asymmetry and long-term PVL unclear.
Valve type has also been proposed as a potential determinant of PVL. While some studies have reported higher rates of PVL with self-expandable (SE) valves compared with balloon-expandable (BE) valves,1,12-14 others have not confirmed this association.10,15 Whether the effect of calcification pattern on PVL varies according to valve type has not been evaluated yet; thus, the incremental value of leaflet-specific AVC asymmetry for predicting longer-term PVL, particularly across different valve types, remains uncertain.
Therefore, we sought to address these knowledge gaps by determining whether leaflet AVC asymmetry is associated with mild PVL or greater at 1 year after TAVR in a large, real-world cohort, and whether this association differs according to valve type.
Methods
Study design
This a retrospective cohort study included patients with severe AS who underwent TAVR and had available 1-year follow-up transthoracic echocardiography (TTE) at our center from January 2022 to May 2025. Patients were eligible for study inclusion if they underwent both preprocedural TTE and non-contrast cardiac CT as well as follow-up TTE approximately 1-year after TAVR. Preprocedural and follow-up TTE examinations were performed as part of routine clinical care and were not obtained specifically for the purposes of this study. Patients with incomplete imaging acquisition, bicuspid valves, and valve-in-valve procedures were excluded from our study. Written informed consent was waived because of the retrospective nature of the study. The study was approved by the institutional review board and conducted in accordance with the Declaration of Helsinki.
Transthoracic echocardiography and cardiac CT
Preprocedural and follow-up TTE examinations were performed as part of routine clinical care according to current guideline recommendations16,17 using commercially available ultrasound systems. Echocardiographic parameters were retrospectively extracted from the existing clinical echocardiographic data for the present study. PVL after TAVR was assessed using color Doppler imaging in multiple acoustic windows, and PVL severity was determined by the interpreting echocardiographer at the time of the clinical examination according to American Society of Echocardiography recommendations.18 Echocardiograms were not retrospectively re-adjudicated by an independent core laboratory for the present analysis.
AVC was quantified using the Agatston scoring method19 on non-contrast, prospectively electrocardiogram-gated multidetector CT acquired with a 256-slice scanner (Brilliance iCT [Philips]) at 70% to 80% of the R–R interval, a slice thickness of 3 mm with calcium being detected as at a threshold of 130 Hounsfield units.20 AVC was defined as calcium on the annular plane as well as aortic valve, with careful exclusion of the left ventricular outflow tract and ascending aorta calcification. AVC was measured for the entire aortic valve and separately for each leaflet using dedicated software (3mensio Structural Heart 10.4 [Pie Medical Imaging]) and was reported in Agatston Units (AU). To assess AVC symmetry, the highest cusp-specific AVC score was divided by the total AVC score. Asymmetric AVC leaflet distribution was defined as an index of greater than 0.5 indicating that more than 50% of the total AVC burden was located within a single cusp. This threshold was prespecified to identify predominant calcification within a single cusp.
Statistical analysis
Continuous variables were reported as mean ± standard deviation or median [interquartile range], depending on their distribution. Categorical variables were reported as absolute numbers and percentages. Patients were stratified into 2 groups according to the presence of mild or greater PVL at 1 year. Group comparisons were performed using the t-test for normally distributed variables, the Mann-Whitney U test for non-normally distributed variables, and the chi-square test for categorical variables. Associations between AVC asymmetry as well as total AVC and mild or greater PVL at 1 year and at 1 day after TAVR were analyzed using binary logistic regression models. Covariates for multivariable analysis were selected a priori based on clinical relevance and their potential to confound the association between AVC and PVL. Age was included as demographic covariate, sex was included because of its association of higher AVC in males, and valve type was included based on previously reported differences in PVL between BE and SE prostheses.7,13-15 A P-value of less than 0.05 was considered statistically significant. All analyses were performed using SPSS Statistics Version 31 (IBM).
Results
A total of 530 patients with severe AS who underwent TAVR with 1-year follow-up echocardiography were included. The mean age was 79 ± 8 years and 241 patients (45.5%) were female. Baseline clinical characteristics are shown in Table 1.
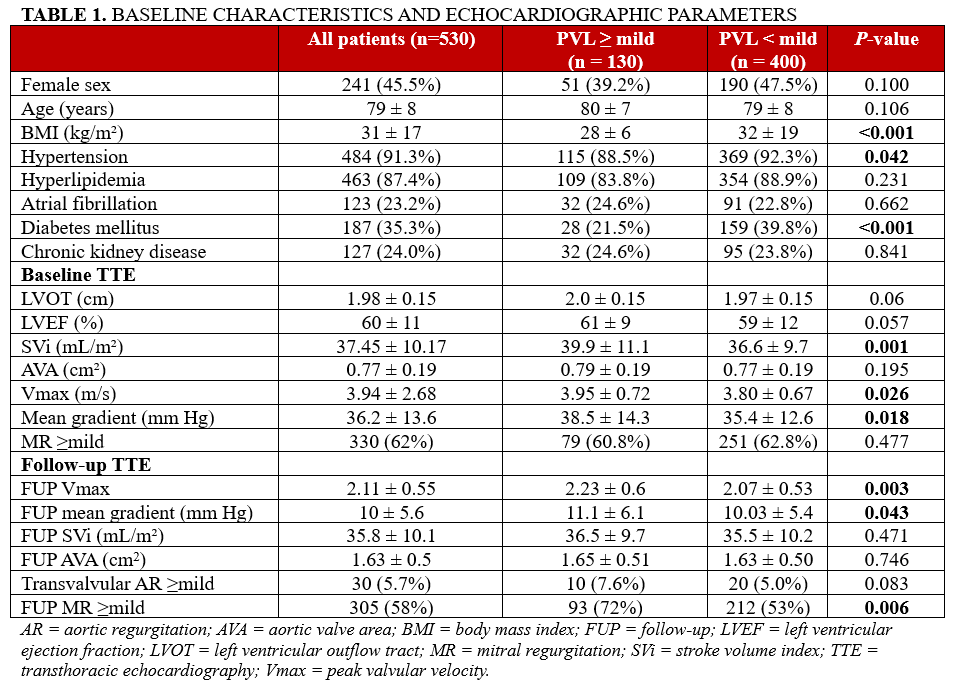
At 1-year follow-up, 130 patients (24.5%) had mild or greater PVL, whereas 400 patients (75.5%) had none or trace PVL. Patients with mild or greater PVL were less often female (51 [39.2%] vs 190 [47.5%], P = .100) and had a lower prevalence of hypertension and diabetes mellitus (Table 1). There was no significant difference in long-term mortality (mean follow-up time 923 ± 322 days) between groups (12 [9.2%] vs 23 [5.8%], P = .174).
Baseline echocardiographic parameters are displayed in Table 1. Patients with mild or greater PVL had significantly higher baseline mean transvalvular gradients (38.5 ± 14.3 vs 35.4 ± 12.6 mm Hg, P = .018) and higher stroke volume index (SVi) (39.9 ± 11.1 vs 36.6 ± 9.7 mL/m², P = .001) compared with those without PVL.
At 1-year follow-up, patients with mild or greater PVL had higher mean transvalvular gradients (11.1 ± 6.1 vs 10.0 ± 5.4 mm Hg, P = .043) and higher peak velocity (2.23 ± 0.6 vs 2.07 ± 0.53 m/s, P = .003). Follow-up SVi and aortic valve area were similar between groups (Table 1). Among patients with mild or greater PVL, 117 had mild or mild-to-moderate PVL, 11 had moderate PVL, and 2 had moderate-to-severe or severe PVL.
Total and leaflet-specific AVC
The total AVC burden was significantly higher in patients who developed mild or greater PVL at 1 year in both sexes (Table 2).
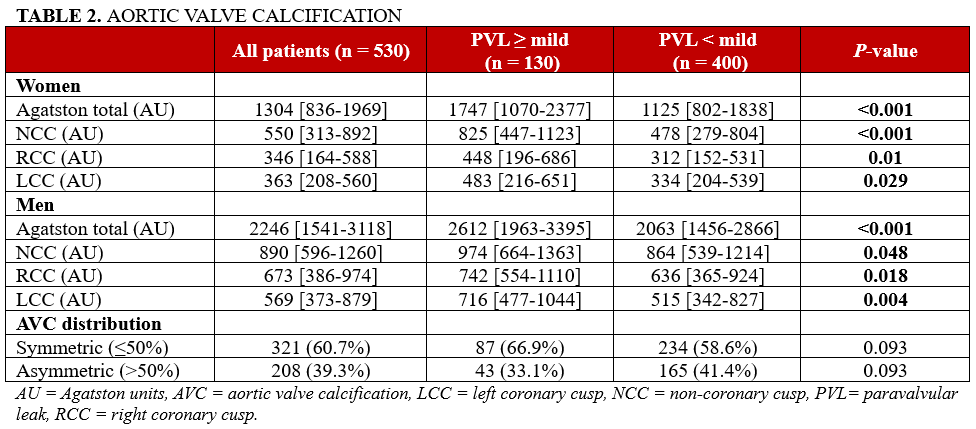
Among females, the median total AVC was 1747 (1070-2377) AU in the PVL group compared with 1125 (802-1838) AU in those without PVL (P < .001). Among males, the total AVC was also higher in the PVL group (2612 [1963-3395] vs 2063 [1456-2866] AU, P < .001).
Leaflet-specific AVC was higher across all cusps in patients with mild or greater PVL in both sexes (Table 2).
AVC asymmetry and PVL
When calcification distribution was categorized as asymmetric (>50% asymmetry index) vs symmetric (≤50% asymmetry index), the prevalence of asymmetric AVC distribution did not differ significantly between groups (Table 2). Asymmetric calcification was present in 43 patients (33.1%) with mild or greater PVL compared with 165 patients (41.4%) without PVL (P = .093).
Association of AVC with PVL
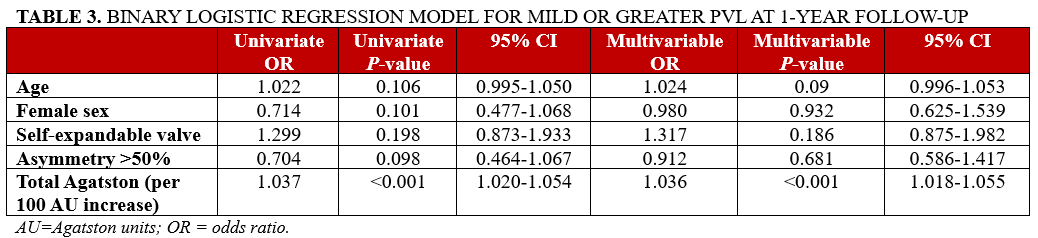
>In univariate binary logistic regression, age (OR, 1.022; P = .106), female sex (OR, 0.714; P = .101), SE valve (OR, 1.299; P = .198), and asymmetric calcification (>50% asymmetry index; OR, 0.704; P = .098) were not significantly associated with mild or greater PVL (Table 3).
In contrast, total AVC was significantly associated with mild or greater PVL, with each 100-AU increase conferring increased odds of PVL (OR, 1.037; P < .001). This association remained significant in multivariable analysis after adjustment for age, sex, asymmetry, and valve type (OR, 1.036 per 100 AU increase; P < .001) (Table 3).
Similar findings were observed when analyzing predictors of mild or greater PVL on day 1 post-TAVR which was present in 25 patients (4.7%) (Supplemental Table 1).
Interaction between valve type and AVC asymmetry
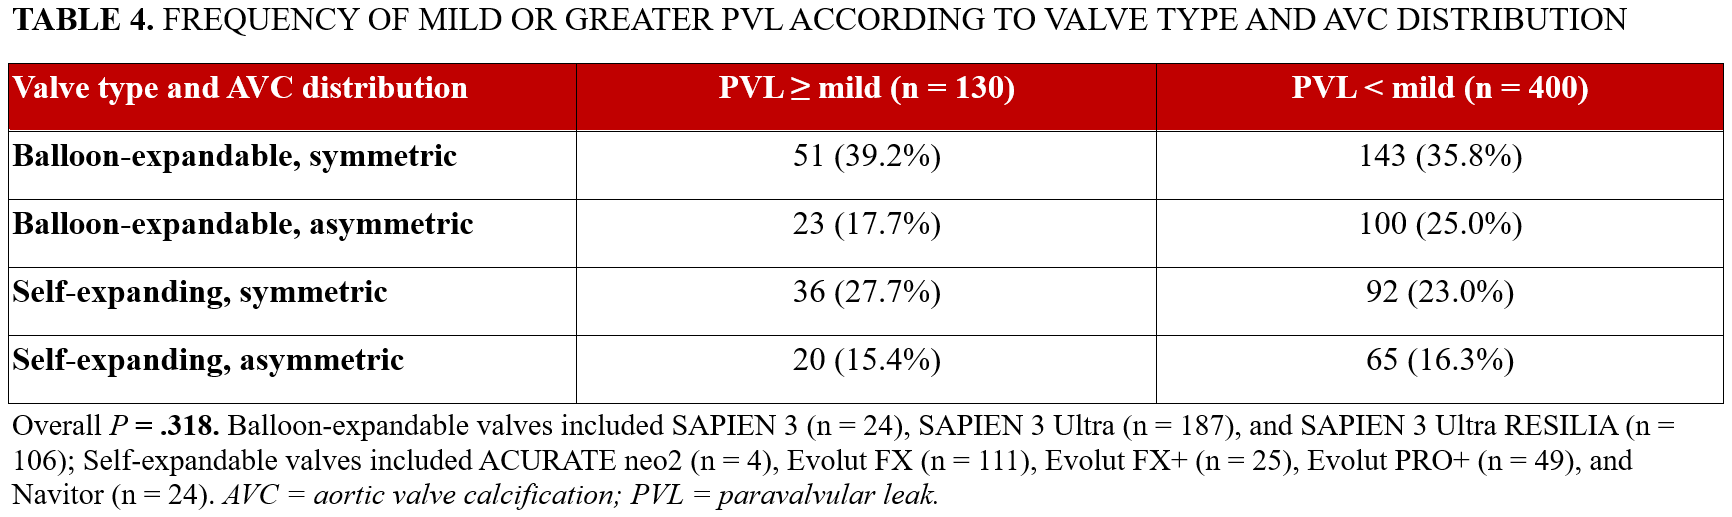
When evaluating the frequency of mild or greater PVL according to valve type (BE vs SE and AVC distribution (symmetric vs asymmetric), no statistically significant difference was observed between valve type, AVC asymmetry, and the occurrence of PVL (P = .318) (Table 4). Additionally, no significant differences in valve size were observed between the mild-or-greater-PVL group and no-PVL group as shown in Supplemental Table 2.
Discussion
The principal novelty of the present study is the evaluation of leaflet-specific AVC asymmetry in relation to PVL at 1-year follow-up in a large, real-world TAVR cohort. While the association between total AVC burden and PVL has been established previously, the prognostic relevance of leaflet-specific calcium distribution, particularly at longer-term follow-up, remains less well defined. In addition, we evaluated whether the relationship between AVC asymmetry and PVL differed according to valve type. Several important findings emerged: first, patients with PVL exhibited significantly greater total AVC burden and higher cusp-specific AVC values in both sexes; second, although asymmetric calcification was present in almost 40% of patients, it was not associated with an increased risk of PVL at 1-year follow-up; third, no significant interaction was observed between valve type and AVC asymmetry with respect to PVL occurrence.
AVC burden and PVL
We observed significantly higher total and cusp-specific AVC in patients with mild or greater PVL at 1 year after TAVR, in both sexes. In addition, total AVC burden remained independently associated with a higher risk of PVL at 1-year follow-up after adjustment for age, sex, valve type, and calcium distribution. Although prior studies have linked greater AVC burden to PVL,1,9,13,21 most were confined to in-hospital or short-term follow-up. Our findings extend these observations by demonstrating not only that total AVC remains predictive of mild or greater PVL at 1 year, but also that AVC burden was consistently higher across all leaflets in patients with PVL. This suggests that calcific burden may exert a persistent adverse effect on device sealing and annular apposition beyond the immediate postprocedural phase. Taken together, these findings underscore the importance of comprehensive preprocedural CT-based assessment of both overall and leaflet-specific AVC burden for procedural planning and risk stratification in patients undergoing TAVR.
AVC asymmetry
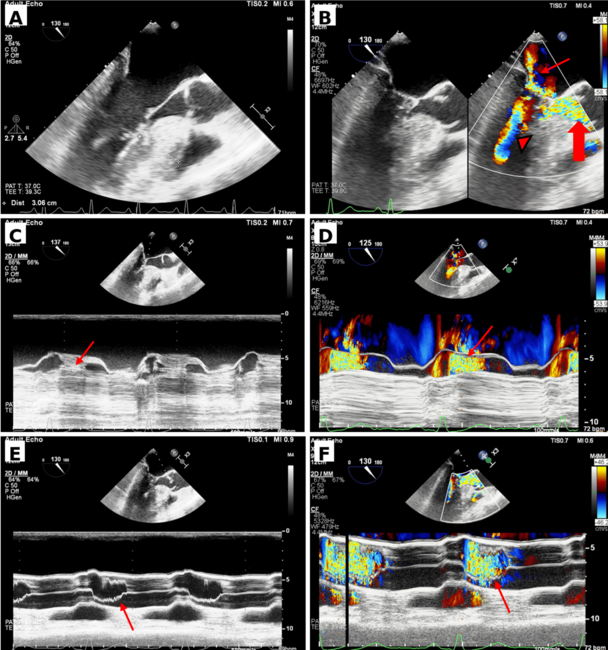
In this large, real-world cohort, leaflet-specific AVC asymmetry was not associated with mild or greater PVL at 1-year follow-up. Although asymmetric calcification was present in approximately 40% of patients, its frequency did not differ between patients with and without PVL, nor was it associated with a higher risk of PVL. Video 1 shows symmetric distribution of calcium on the aortic valve leaflets captured during intraprocedural transesophageal echocardiography (TEE), and Video 2 shows asymmetric distribution of calcium on the leaflets of the aortic valve, with the most calcium being on the commissure between the left and right aortic cusps.
To date, only a few small studies have examined the relationship between leaflet-specific AVC distribution and PVL.8,10,11 In a cohort of 150 patients undergoing TAVR, Khalique et al showed that calcium volume quantified on contrast-enhanced CT was not predictive of mild or greater PVL immediately after the procedure, although only 28 patients developed this endpoint.8 Similarly, in a study of 57 patients using Agatston-based AVC quantification, calcium distribution was not associated with PVL assessed angiographically immediately after TAVR.11 Consistent findings were reported in another cohort of 108 patients, in which AVC distribution measured on contrast-enhanced CT was not significantly associated with PVL at discharge.10 Although these smaller studies consistently failed to demonstrate a significant association between leaflet-specific calcific asymmetry and PVL, their interpretation was limited by relatively low sample sizes, predominantly early follow-up, and nonuniform AVC quantification methods. By using guideline-recommended Agatston-based AVC quantification in a substantially larger real-world cohort with 1-year follow-up, our study provides robust confirmation that AVC asymmetry is not an independent risk factor for PVL. These findings suggest that the overall magnitude of calcific burden may be more relevant to the development of PVL than leaflet-specific distribution.
Valve type, AVC asymmetry, and PVL
In our study, no significant interaction was observed between valve type and AVC asymmetry with respect to PVL at 1-year follow-up. Previous studies reported higher PVL rates after TAVR with SE vs BE prostheses.1,7,13,22 In our cohort, however, SE valve type was not significantly associated with PVL at 1 year after TAVR in univariate analysis. One possible explanation is the inclusion of newer-generation valves, as prior data suggest that PVL rates have become more comparable between SE and BE platforms with contemporary devices.15 However, other studies have continued to report higher rates of PVL with newer-generation SE devices.7,13 Video 3 displays a midesophageal long-axis view of the transcatheter aortic valve with significant posterior paravalvular regurgitation captured on intraprocedural TEE.
A unique finding of our study is that PVL frequency was not influenced by the combination of valve type and AVC asymmetry. In line with this, the meta-analysis by Shi et al, which pooled data from 24 observational studies, showed that higher AVC burden was associated with PVL irrespective of valve type.23 To the best of our knowledge, no prior study has directly evaluated the combined effect of AVC asymmetry and valve type on PVL at 1-year follow-up. In our analysis, total AVC burden remained the only independent predictor of PVL, even after adjustment for valve type. Hence, our findings suggest that total AVC burden, rather than valve type or leaflet-specific calcification pattern, is the most relevant calcific determinant of PVL risk at 1 year.
Future studies should focus on integrating advanced Agatston-based AVC quantification into procedural planning algorithms and device selection strategies. Larger prospective multicenter analyses examining the interplay between calcification burden, calcification distribution, valve design, and procedural technique may further clarify the mechanisms underlying PVL and improve patient selection and procedural outcomes.
Limitations
Several limitations should be acknowledged. First, this was a retrospective, single-center study and therefore subject to the inherent limitations of that design. Second, inclusion required availability of 1-year follow-up echocardiography at our center, which may have introduced selection bias by excluding patients without follow-up imaging. Echocardiographic parameters and PVL severity were retrospectively obtained from clinically performed examinations, and our procedural data did not include pre-/postdilation rates or prothesis oversizing. Third, our analysis focused exclusively on the quantification and distribution of calcification within the aortic valve leaflets, and we did not assess LVOT calcification. Lastly, the greater than 0.5 threshold used to define AVC asymmetry is novel in our study and has not been previously validated. Nevertheless, the large, real-world cohort, use of guideline-recommended Agatston-based AVC quantification, and availability of 1-year follow-up strengthen the clinical relevance of our findings for PVL risk stratification after TAVR.
Conclusions
Although patients with PVL exhibited higher total and leaflet-specific AVC burden, AVC asymmetry was not associated with an increased risk of PVL at 1 year after TAVR. In addition, the combination of valve type and AVC asymmetry did not significantly influence PVL risk. Total AVC burden emerged as the only significant predictor of PVL at 1-year follow-up, underscoring the importance of comprehensive preprocedural AVC quantification for risk stratification before TAVR.
Affiliations and Disclosures
Pragati Basera, MBBS1; Roya Anahita Mousavi, MD2; Chisom Enwere, MD3; Minel Soroa, MD2; Edgar Argulian, MD4; Leila Alizadeh, MD2; Marcos Ferrandez-Escarabajal, MD2; Carlo Mannina, MD4; Lakshay Chopra, MD4; Samin K. Sharma, MD2; Annapoorna S. Kini, MD2; Stamatios Lerakis, MD, PhD2
Dr Basera and Dr Mousavi contributed equally to the manuscript.
From the 1Department of Internal Medicine, Mount Sinai Morningside/West, Icahn School of Medicine at Mount Sinai, New York, New York; 2Division of Cardiology, Mount Sinai Fuster Heart Hospital, Icahn School of Medicine at Mount Sinai, New York, New York; 3Department of Medicine, Mount Sinai Hospital, Icahn School of Medicine at Mount Sinai, New York, New York; 4Division of Cardiology, Mount Sinai Morningside/West, Icahn School of Medicine at Mount Sinai, New York, New York.
Disclosures:< Dr Mousavi was supported by a research grant from the Max Kade Foundation, New York, USA, granted by the Austrian Academy of Sciences, Vienna, Austria. Dr Soroa was supported by a FUNDAME grant from the Alfonso Martín Escudero Foundation (Madrid, Spain). The remaining authors report no financial relationships or conflicts of interest regarding the content herein.
Address for correspondence: Stamatios Lerakis, MD, PhD, Department of Cardiology, Mount Sinai Fuster Heart Hospital, Icahn School of Medicine at Mount Sinai, 1 Gustave L Levy Pl, New York, NY 10029, USA. Email: stamatios.lerakis@mountsinai.org; X: @RoyaMousavi_MD, @basera_pragati, @argulian, @LeilaAlizadehMD
References
1. Athappan G, Patvardhan E, Tuzcu EM, et al. Incidence, predictors, and outcomes of aortic regurgitation after transcatheter aortic valve replacement: meta-analysis and systematic review of literature. J Am Coll Cardiol. 2013;61(15):1585-1595. doi:10.1016/j.jacc.2013.01.047
2. Abdel-Wahab M, Zahn R, Horack M, et al; German transcatheter aortic valve interventions registry investigators. Aortic regurgitation after transcatheter aortic valve implantation: incidence and early outcome. Results from the German transcatheter aortic valve interventions registry. Heart. 2011;97(11):899-906. doi:10.1136/hrt.2010.217158
3. Watanabe Y, Yamamoto M, Hioki H, et al; OCEAN-TAVI Investigators. Long-term impact of mild paravalvular regurgitation after transcatheter aortic valve replacement: the OCEAN-TAVI registry. JACC Cardiovasc Interv. 2026;19(1):63-75. doi:10.1016/j.jcin.2025.09.004
4. Sciaramenti G, Menzato E, Clo' S, et al. Paravalvular leak after transcatheter aortic valve replacement (TAVR): a literature review. J Clin Med. 2025;14(24):8905. doi:10.3390/jcm14248905
5. Willson AB, Webb JG, Labounty TM, et al. 3-dimensional aortic annular assessment by multidetector computed tomography predicts moderate or severe paravalvular regurgitation after transcatheter aortic valve replacement: a multicenter retrospective analysis. J Am Coll Cardiol. 2012;59(14):1287-1294. doi:10.1016/j.jacc.2011.12.015
6. Tang GHL, Zaid S, Schnittman SR, et al. Novel predictors of mild paravalvular aortic regurgitation in SAPIEN 3 transcatheter aortic valve implantation. EuroIntervention. 2018;14(1):58-68. doi:10.4244/EIJ-D-18-00005
7. Hokken TW, Veulemans V, Adrichem R, et al. Sex-specific aortic valve calcifications in patients undergoing transcatheter aortic valve implantation. Eur Heart J Cardiovasc Imaging. 2023;24(6):768-775. doi:10.1093/ehjci/jead005
8. Khalique OK, Hahn RT, Gada H, et al. Quantity and location of aortic valve complex calcification predicts severity and location of paravalvular regurgitation and frequency of post-dilation after balloon-expandable transcatheter aortic valve replacement. JACC Cardiovasc Interv. 2014;7(8):885-894. doi:10.1016/j.jcin.2014.03.007
9. Jilaihawi H, Makkar RR, Kashif M, et al. A revised methodology for aortic-valvar complex calcium quantification for transcatheter aortic valve implantation. Eur Heart J Cardiovasc Imaging. 2014;15(12):1324-1332. doi:10.1093/ehjci/jeu162
10. Sakrana AA, Nasr MM, Ashamallah GA, Abuelatta RA, Naeim HA, Tahlawi ME. Paravalvular leak after transcatheter aortic valve implantation: is it anatomically predictable or procedurally determined? MDCT study. Clin Radiol. 2016;71(11):1095-1103. doi:10.1016/j.crad.2016.07.016
11. Koos R, Mahnken AH, Dohmen G, et al. Association of aortic valve calcification severity with the degree of aortic regurgitation after transcatheter aortic valve implantation. Int J Cardiol. 2011;150(2):142-145. doi:10.1016/j.ijcard.2010.03.004
12. Hagar A, Li Y, Wei X, et al. Incidence, predictors, and outcome of paravalvular leak after transcatheter aortic valve implantation. >J Interv Cardiol. 2020;2020:8249497. doi:10.1155/2020/8249497
13. Mauri V, Frohn T, Deuschl F, et al. Impact of device landing zone calcification patterns on paravalvular regurgitation after transcatheter aortic valve replacement with different next-generation devices. Open Heart. 2020;7(1):e001164. doi:10.1136/openhrt-2019-001164
14. Abdel-Wahab M, Mehilli J, Frerker C, et al; CHOICE investigators. Comparison of balloon-expandable vs self-expandable valves in patients undergoing transcatheter aortic valve replacement: the CHOICE randomized clinical trial. JAMA. 2014;311(15):1503-1514. doi:10.1001/jama.2014.3316
15. Thiele H, Kurz T, Feistritzer HJ, et al. Comparison of newer generation self-expandable vs. balloon-expandable valves in transcatheter aortic valve implantation: the randomized SOLVE-TAVI trial. Eur Heart J. 2020;41(20):1890-1899. doi:10.1093/eurheartj/ehaa036
16. Baumgartner H, Hung J, Bermejo J, et al. Recommendations on the echocardiographic assessment of aortic valve stenosis: a focused update from the European Association of Cardiovascular Imaging and the American Society of Echocardiography. J Am Soc Echocardiogr. 2017;30(4):372-392. doi:10.1016/j.echo.2017.02.009
17. Lancellotti P, Pellikka PA, Budts W, et al. The clinical use of stress echocardiography in non-ischaemic heart disease: recommendations from the European Association of Cardiovascular Imaging and the American Society of Echocardiography. Eur Heart J Cardiovasc Imaging. 2016;17(11):1191-1229. doi:10.1093/ehjci/jew190
18. Zoghbi WA, Asch FM, Bruce C, et al. Guidelines for the evaluation of valvular regurgitation after percutaneous valve repair or replacement: a report from the American Society of Echocardiography developed in collaboration with the Society for Cardiovascular Angiography and Interventions, Japanese Society of Echocardiography, and Society for Cardiovascular Magnetic Resonance. J Am Soc Echocardiogr. 2019;32(4):431-475. doi:10.1016/j.echo.2019.01.003
19. Agatston AS, Janowitz WR, Hildner FJ, Zusmer NR, Viamonte M Jr, Detrano R. Quantification of coronary artery calcium using ultrafast computed tomography. J Am Coll Cardiol. 1990;15(4):827-832. doi:10.1016/0735-1097(90)90282-t
20. Pawade T, Sheth T, Guzzetti E, Dweck MR, Clavel MA. Why and How to Measure Aortic Valve Calcification in Patients With Aortic Stenosis. JACC Cardiovasc Imaging. 2019;12(9):1835-1848. doi:10.1016/j.jcmg.2019.01.045
21. El Faquir N, Wolff Q, Sakhi R, et al. Distribution of aortic root calcium in relation to frame expansion and paravalvular leakage after transcatheter aortic valve implantation (tavi): an observational study using a patient-specific contrast attenuation coefficient for calcium definition and independent core lab analysis of paravalvular leakage. J Cardiovasc Imaging. 2022;30(4):292-304. doi:10.4250/jcvi.2021.0141
22. Abdel-Wahab M, Comberg T, Büttner HJ, et al; Segeberg-Krozingen TAVI Registry. Aortic regurgitation after transcatheter aortic valve implantation with balloon- and self-expandable prostheses: a pooled analysis from a 2-center experience. JACC Cardiovasc Interv. 2014;7(3):284-292. doi:10.1016/j.jcin.2013.11.011
23. Shi J, Li W, Zhang T, et al. Quantity and location of aortic valve calcification predicts paravalvular leakage after transcatheter aortic valve replacement: a systematic review and meta-analysis. Front Cardiovasc Med. 2023;10:1170979. doi:10.3389/fcvm.2023.1170979