






Adoption of Intravascular Imaging Use Among Intermediate to High-Volume Operators in the United States From 2019 to 2023: A Medicare Data Analysis
© 2026 HMP Global. All Rights Reserved.
Any views and opinions expressed are those of the author(s) and/or participants and do not necessarily reflect the views, policy, or position of the Journal of Invasive Cardiology or HMP Global, their employees, and affiliates.
J INVASIVE CARDIOL 2026. doi:10.25270/jic/26.00146. Epub July 7, 2026.
Key Clinical Summary
- Intravascular imaging (IVI) use increased substantially from 2019-2023, yet more than half of intermediate- and high-volume PCI operators remained low or non-users.
- Non-adoption was independently associated with earlier graduation, higher PCI volume, practice at smaller hospitals, and practice in the South, but not with teaching status, gender, practice focus, or hospital affiliation changes.
- Once adopted, IVI use was sustained, with few operators reducing use, while newly-practicing operators had the highest adoption rates.
Abstract
Objectives. Intravascular imaging (IVI) with percutaneous coronary intervention (PCI) in the United States has historically been low, but there have been recent increases. However, how IVI use has changed at an operator level and the characteristics of operators who adopted IVI vs those who did not are unknown.
Methods. Using Medicare Provider Utilization and Payment data, the authors identified PCI operators in 2019 and 2023 who performed at least 30 PCI annually. IVI use was categorized as low/none (IVI to PCI ratio [IPR]: 0.0-0.30), intermediate (IPR: 0.31-0.70) and high (IPR: ≥0.71). Regression models identified provider characteristics associated with IVI adoption.
Results. In 2019, 3385 operators performed at least 30 PCI. IVI use in 2019 was low/none among 77.8% operators, intermediate in 15.7%, and high in 6.4%. In 2023, 2289 operators performed at least 30 PCI. IVI use in 2023 was low/none among 48.8% operators, intermediate in 21.8%, and high in 29.3%. Among 1671 operators active in both years, 30.9% of prior low/none users adopted IVI. Only 12.2% of intermediate or high IVI users had a reduction in IVI use. Newer high-volume operators showed high IVI use (51.1%). Non-adoption of IVI was associated with earlier graduation year, smaller hospitals, Southern region, and higher procedural volume, while gender, practice focus, teaching status of affiliated hospital, and hospital affiliation changes were not significant.
Conclusions. IVI use has increased nationally but adoption remains uneven, with structural and generational factors driving persistent disparities and highlighting the need for targeted implementation strategies.
Introduction
Intravascular imaging (IVI) use with percutaneous coronary intervention (PCI) in the United States has historically been low. We previously showed that, at an operator level among intermediate- to high-volume operators in 2019, IVI was low (≤30%) among 3 out of 4 operators.1 Recently, however, there has been an increase in data supporting IVI use2 and, in parallel, IVI use in the United States has been increasing.3 In this context, understanding how IVI use has changed at an operator level and what the differences are between operators who adopted IVI and those who continued to have low IVI use can inform future policy and training efforts. Using Medicare Provider Utilization and Payment (MPUP) data, we compared IVI use by individual operators in 2019 to that in 2023.
Methods
Data source and study population
Using MPUP for 2019 and 2023, we identified PCI operators and obtained their PCI and IVI volumes using Current Procedural Terminology (CPT) codes. We focused on operators with an annual Medicare Fee-For-Service (FFS) PCI volume of at least 30—a cohort representative of intermediate to high-volume operators based on prior studies.1 This study was exempt from institutional review board approval.
Outcomes and covariates
IVI use was categorized as low/none (IVI to PCI ratio [IPR]: 0.0-0.30), intermediate (IPR: 0.31-0.70), and high (IPR: ≥0.71). The lower cutoff was set at 0.30, as the MPUP data suppress CPT codes with less than 10 billings; thus, an operator with at least 30 PCI and no IVI billing has less than 10 IVI and thus an IPR of less than or equal to 0.30.
Operator characteristics were obtained by linking National Provider Identification numbers to Medicare Physician Compare Data, Doctors and Clinicians National Downloadable Files, and Inpatient Prospective Payment System Impact Files. Operator characteristics included gender, practice focus, PCI volume (≥50 PCI vs <50), US census region, medical school graduation year quartile (Q1: earlier graduation vs Q4: recent graduation), bed size of primary affiliated facility (Q1: smaller hospital vs Q4: larger hospital), teaching status, and whether the PCI operator changed their primary affiliated facility, ie, primary practice site. The 4 practice focus categories were defined based on whether the PCI operator performed only PCI or additionally performed peripheral or structural procedures using their billed CPT codes (Supplemental Table): PCI only, PCI with peripheral, PCI with structural, and PCI with both structural and peripheral.
Statistical analysis
Categorical variables were compared using chi-squared tests. A generalized linear model with logit link was used to identify independent variables. Significance was set at a 2-sided P-value of 0.05. Analyses were performed using Python (Python Software Foundation) and Stata v17 (StataCorp LLC).
Results
Overall, use of IVI in Medicare FFS increased from 15.3 per 100 PCI in 2019 (N = 56 732/369 771) to 34.6 per 100 PCI in 2023 (N = 94 068/271 961).
In 2019, 3385 operators performed at least 30 PCI (intermediate- to high-volume PCI operators). IVI use in 2019 was low/none among 77.8% of operators (2635), intermediate in 15.7% (533), and high in 6.4% (217). In 2023, 2289 operators performed at least 30 PCI. IVI use in 2023 was low/none among 48.8% of operators (1118), intermediate in 21.8% (500), and high in 29.3% (671).
Among the 3385 intermediate- to high-volume PCI operators in 2019, 49.3% (1671) continued to perform at least 30 PCIs in Medicare FFS in 2023; 32.9% (1116) performed between 10 and 29 PCIs, and 17.6% (598) performed no or less than 10 PCI.
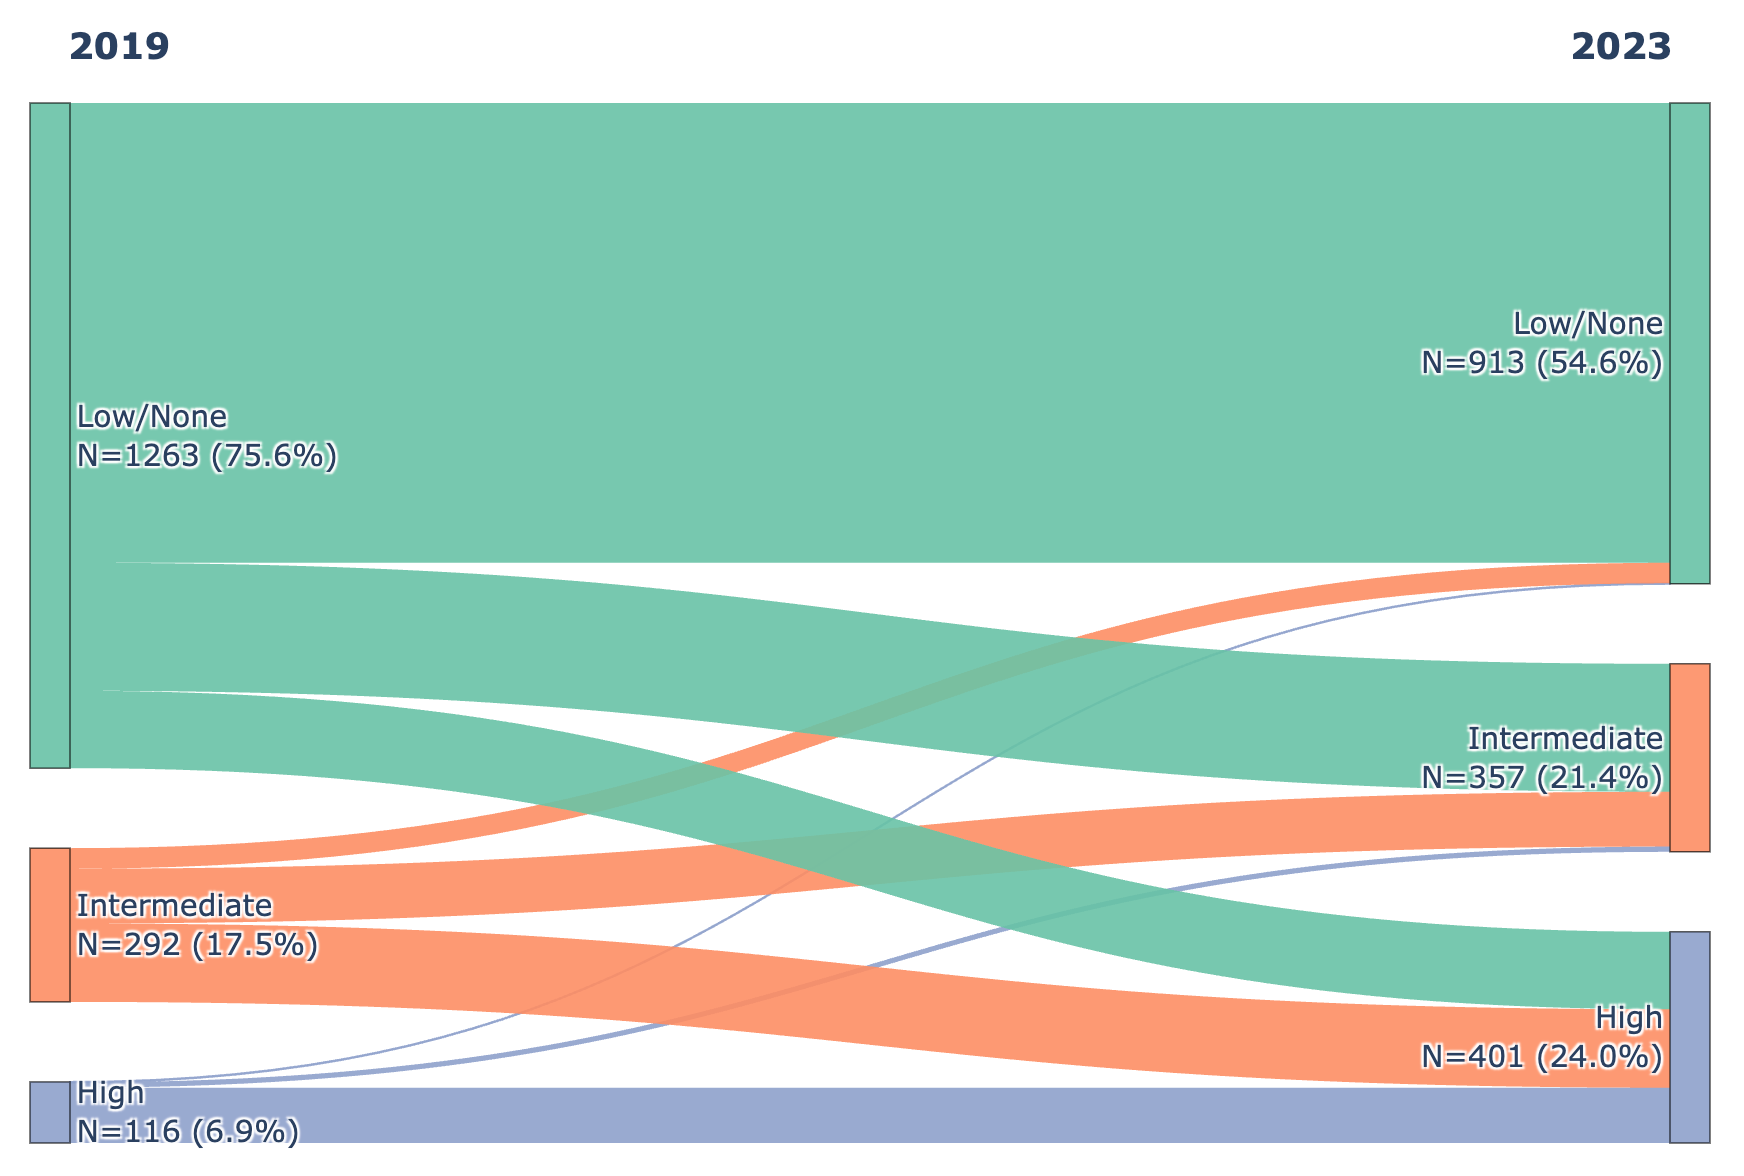
Among the 1671 operators who performed at least 30 PCIs in both 2019 and 2023, the proportion of IVI use in 2023 was low/none in 54.6% (913), intermediate in 21.4% (357), and high in 24% (401). Among low/no IVI use operators in 2019 (1263), 30.9% (390) adopted IVI (became intermediate or high IVI users) in 2023. Among intermediate or high IVI users in 2019 (408), only 12.2% (50) had a reduction in IVI use (Figure 1). Among operators performing at least 30 PCI in 2023 but none (≤10) in 2019 (354), presumably new operators as their median medical school graduation year was 2012, IVI use was low/none in 22.9% (81), intermediate in 26% (92), and high in 51.1% (181).
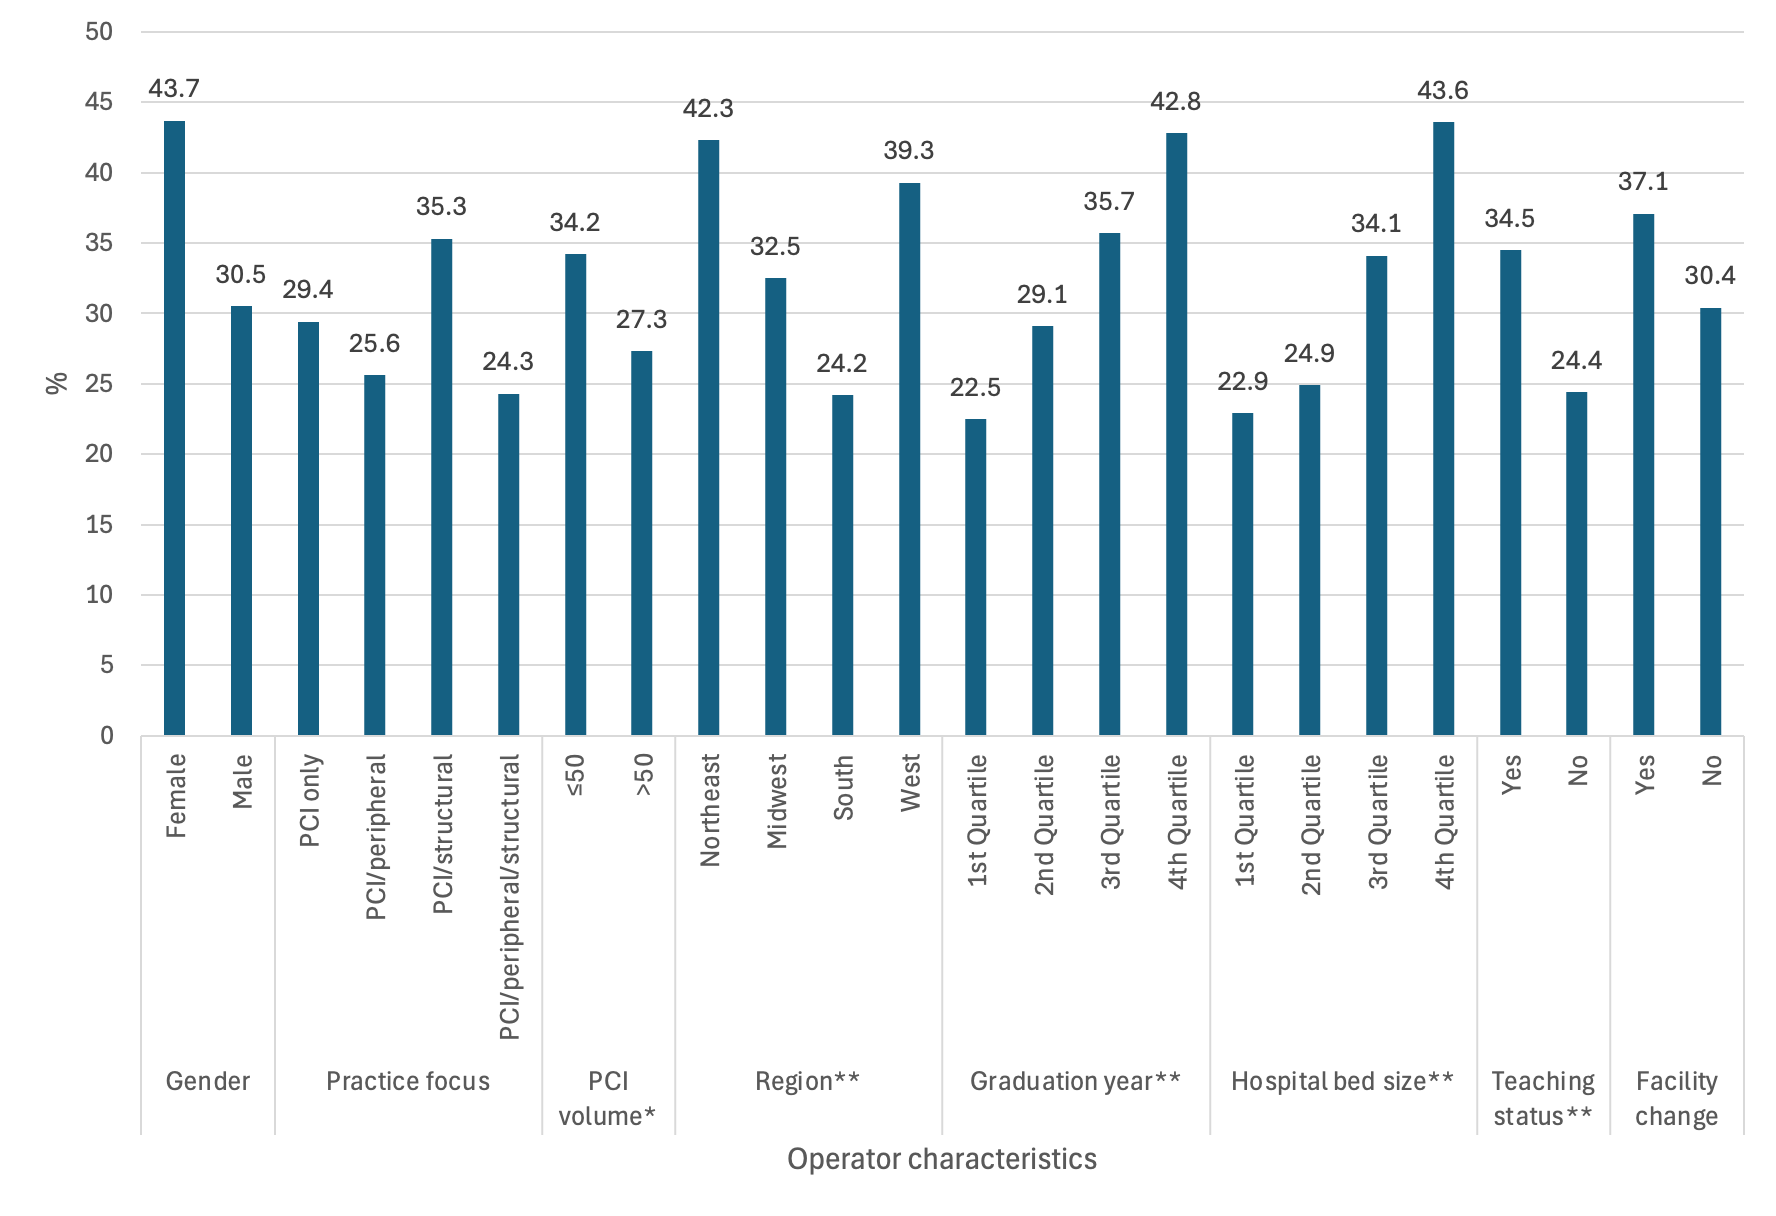
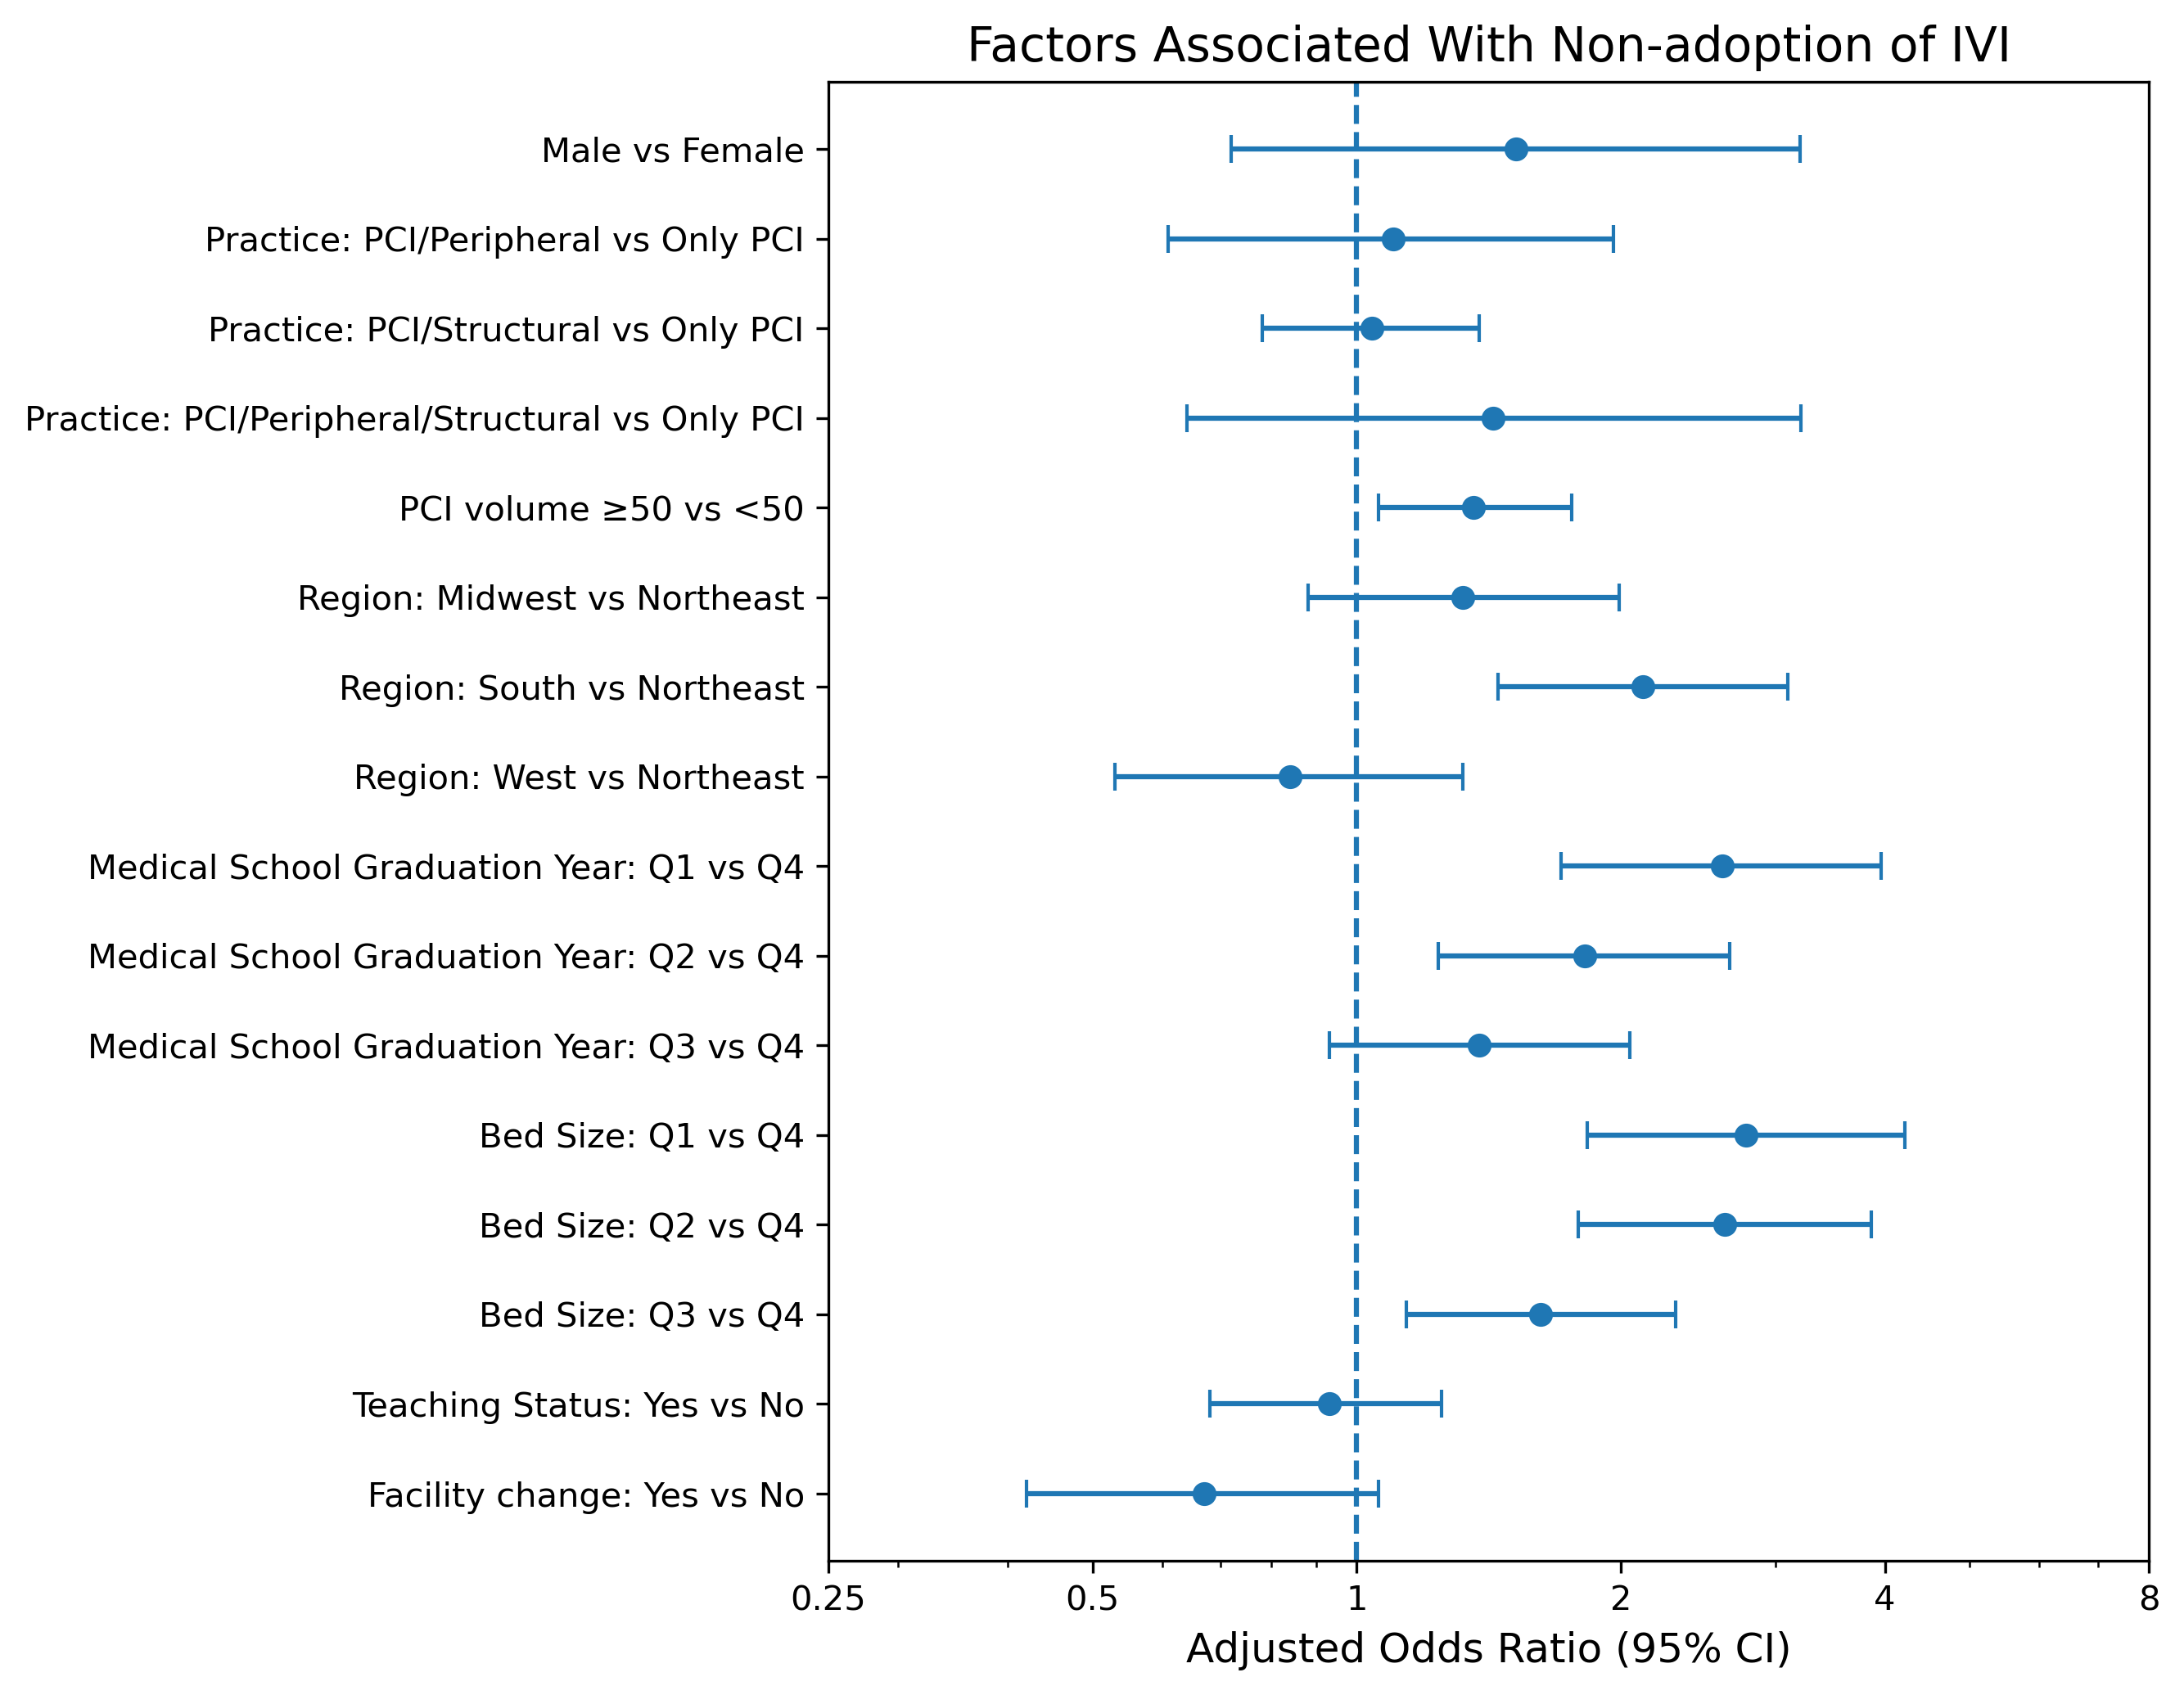
The proportion of 2019 low/no IVI use operators who adopted IVI in 2023 by operator characteristics is shown in Figure 2. In the adjusted model, the characteristics independently associated with not adopting IVI in 2023 were those who graduated earlier (odds ratio [OR], 2.6 [1.7-4.0] Q1 vs Q4) or practicing at smaller hospitals (OR, 2.8 [1.8-4.2] Q1 vs Q4), those in the South (OR, 2.1 [1.5-3.1]) compared with the Northeast, and higher volume operators (OR, 1.4 [1.1-1.8] ≥50 PCI vs <50 PCI). Operator gender, practice focus, teaching status, and change in hospital affiliation from 2019 to 2023 had no influence on IVI use (Figure 3).
Discussion
In this national analysis of intermediate-high volume PCI operators, IVI adoption increased between 2019 and 2023. In 2019, IVI use was predominantly low or absent (77.8% of operators), whereas by 2023 nearly one-third were high users and fewer than half remained low/no users. Adoption was dynamic: nearly one-third of previously low/no users transitioned to intermediate or high use, and more than half of intermediate users escalated to high IVI use.
Adoption was uneven across operator and institutional characteristics. Non-adopters were more likely to have graduated earlier (ie, in practice longer), practice at smaller hospitals, and be located in the South; associations persisted after adjustment. In contrast, gender, practice focus, teaching status of affiliated hospital, and hospital affiliation changes were not associated with IVI adoption, indicating that structural and generational factors may be more influential. Interestingly, higher-volume operators were also less likely to adopt IVI, suggesting that established practice patterns among experienced or busy operators may limit incorporation of newer adjunctive technologies. Notably, these factors mirror those previously associated with low IVI use in general,1 underscoring the importance of structural and local practice environments in shaping technology diffusion; thus, low IVI users in environments with higher IVI use may be more likely to adopt IVI.
Only a small minority (12.2%) of intermediate or high users de-escalated, suggesting that once incorporated into practice, IVI tends to be sustained. However, attrition in PCI volume was substantial, with only half of operators performing at least 30 PCIs in 2019 maintaining this threshold in 2023. Total PCI volume in Medicare reduced from 369 771 in 2019 to 279 842 in 2023. Although there has been a 12% shift in coverage from Medicare FFS to Medicare Advantage4 during this period, it does not fully account for this decline and likely reflects broader changes in operator practice patterns over time.
These findings carry important clinical and policy implications. Despite evidence supporting imaging-guided PCI, substantial regional and institutional disparities persist in IVI use. Barriers may include resource constraints, training exposure, reimbursement considerations, and practice culture. Targeted educational efforts, mentorship, and institutional support can narrow these gaps.
Limitations
Limitations to the study include restriction to intermediate- and high-volume operators because of data suppression, inability to link IVI to specific PCI procedures, inability to attribute PCI practice variables—such as complex PCI operators—because of data limitations, and generalizability limited to Medicare FFS. Further, the study period does not reflect operator response to upgraded recommendations for IVI in recent guidelines5 or recent trial data showing mixed results for IVI.6
Conclusions
IVI use is increasing in the United States, but adoption trends are uneven. Lower adoption in smaller institutions and certain geographic regions, as well as by operators who have been longer in practice, could improve with targeted efforts.
Affiliations and Disclosures
Karthik Murugiah, MBBS, MHS1,2; Mitsuaki Sawano, MD, PhD3; Chenxi Huang, PhD1,2; Mariyam Rafla Hassan, MBBS4; Daniel Chamié, MD, PhD1; Jeptha P. Curtis, MD1; Harlan M. Krumholz, MD, SM1,2,5
From the 1Section of Cardiovascular Medicine, Department of Internal Medicine, Yale School of Medicine, New Haven, Connecticut; 2Center for Outcomes Research and Evaluation, Yale-New Haven Hospital, New Haven, Connecticut; 3Teikyo Academic Research Center, Teikyo University, Tokyo, Japan; 4Geisinger Medical Center, Danville, Pennsylvania; 5Yale School of Public Health, New Haven, Connecticut.
Disclosures: Dr Sawano reported receiving research funding from Pfizer, Novartis, and Polybio and lecture fees from Boehringer Ingelheim and Abbott outside the submitted work. Dr. Chamié has received consulting and speaker fees from Boston Scientific. Dr Curtis has a contract with the American College of Cardiology (ACC) for his role as Chief Scientific Advisor of the ACC’s National Cardiovascular Data Registry. Dr Krumholz has received options for Element Science and Identifeye and payments from F-Prime for advisory roles; is a co-founder of and holds equity in Hugo Health, Refactor Health, and ENSIGHT-AI; and is associated with research contracts through Yale University from Janssen, Kenvue, Novartis, and Pfizer. The remaining authors report no financial relationships or conflicts of interest regarding the content herein.
Funding: Dr Murugiah has received support from the National Heart, Lung, and Blood Institute of the National Institutes of Health (under award K08HL157727).
Address for correspondence: Karthik Murugiah MD, 195 Church St, 5th Floor, New Haven, CT 06510, USA. Email: karthik.murugiah@yale.edu; X: @murugiah_k
References
1. See C, Sawano M, Nagpal S, Chamie D, Curtis JP, Murugiah K. Intravascular imaging use by intermediate to high-volume US operators - a Medicare data analysis. J Soc Cardiovasc Angiogr Interv. 2023;2(5):100977. doi:10.1016/j.jscai.2023.100977
2. Zhang J, Gao X, Kan J, et al. Intravascular ultrasound versus angiography-guided drug-eluting stent implantation: the ULTIMATE trial. J Am Coll Cardiol. 2018;72(24):3126-3137. doi:10.1016/j.jacc.2018.09.013
3. Stein EJ, Mesenbring E, Smith T, et al. Intravascular imaging as a performance measure for percutaneous coronary intervention. Circ Cardiovasc Interv. 2025;18(2):e014528. doi:10.1161/CIRCINTERVENTIONS.124.014528
4. Fuglesten Biniek J, Freed M, Ochieng N, Neuman T. Medicare Advantage enrollment grew by about 1 million people, mainly due to special needs plans. KFF. February 23, 2026. Accessed May 10, 2026. https://www.kff.org/medicare/medicare-advantage-enrollment-grew-by-about-1-million-people-mainly-due-to-special-needs-plans/
5. Rao SV, O'Donoghue ML, Ruel M, et al; Peer Review Committee Members. 2025 ACC/AHA/ACEP/NAEMSP/SCAI guideline for the management of patients with acute coronary syndromes: a report of the American College of Cardiology/American Heart Association joint committee on clinical practice guidelines. J Am Coll Cardiol. 2025;85(22):2135-2237. doi:10.1016/j.jacc.2024.11.009
6. Diletti R, Daemen J, Faurie B, et al; IVUS-CHIP Investigators. Intravascular ultrasound-guided or angiography-guided complex high-risk PCI. N Engl J Med. 2026;394(22):2200-2211. doi:10.1056/NEJMoa2601521